Telerik Reports
Overview
Telerik is a custom reporting tool that allows administrators to create vibrant, detailed, ad-hoc reports. With this free utility, you can build rich, interactive, data visualizations with a few clicks of your mouse. This extremely powerful and adaptable application includes myriad options for data collection and customization. Once you get it set up, Telerik will have access to all of your Jenzabar SONIS tables. You can visualize your data in a chart and add your own custom header, footer, and uploaded images.
For hosted clients, the initial setup will be primarily handled by Jenzabar SONIS Cloud Services. For self-hosted clients and those who may need to do a little additional setup, visit the Telerik Configuration page to get started.
Note
Though all administrative users can view reports, only users logged in with a master profile can build reports. Master profile users can also control access to reports.
Help Resources
We highly recommend that anyone who will be using Telerik begin by taking their Video Onboarding course. Telerik offers a robust library of training and help documents. These should be your primary resource for learning and troubleshooting when it comes to using the Telerik utility.
Additionally, we have two SONIS-specific resources that can be of assistance. The first is a set of Telerik Learning & Development courses created in conjunction with our lead developer on the project. These courses provide a brief overview of what Telerik is, how it interacts with Jenzabar SONIS, and how to create a basic report. The second is a list of some of the most Commonly Used SONIS Tables that will help familiarize you with the table structure that you'll need to understand to fully utilize Telerik.
Getting Started
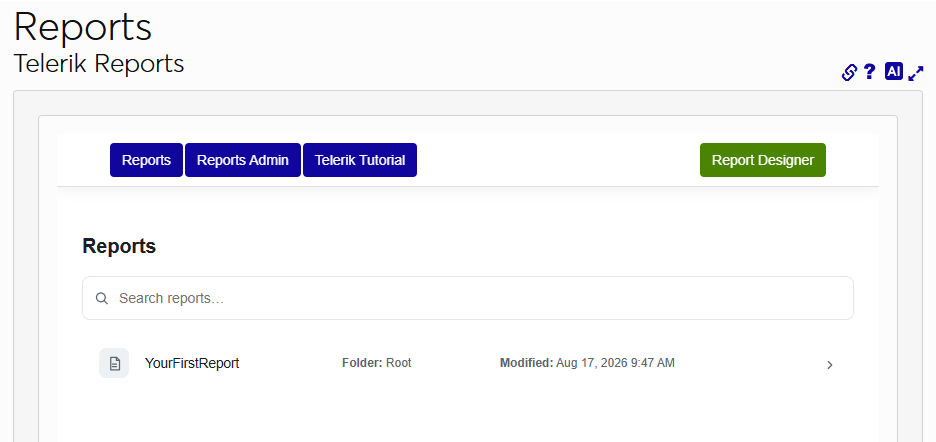
Navigate to Telerik Reports under the Reports hub. You'll see two or four buttons depending on your profile type.
Tip
You can click the Expand icon  on the top right to open the Telerik tool in a full tab at any time.
All staff users have a Reports button. Click this to view a list of all the reports that are available to you.
The Telerik Tutorial button is also available for all users and links to Telerik's help documentation.
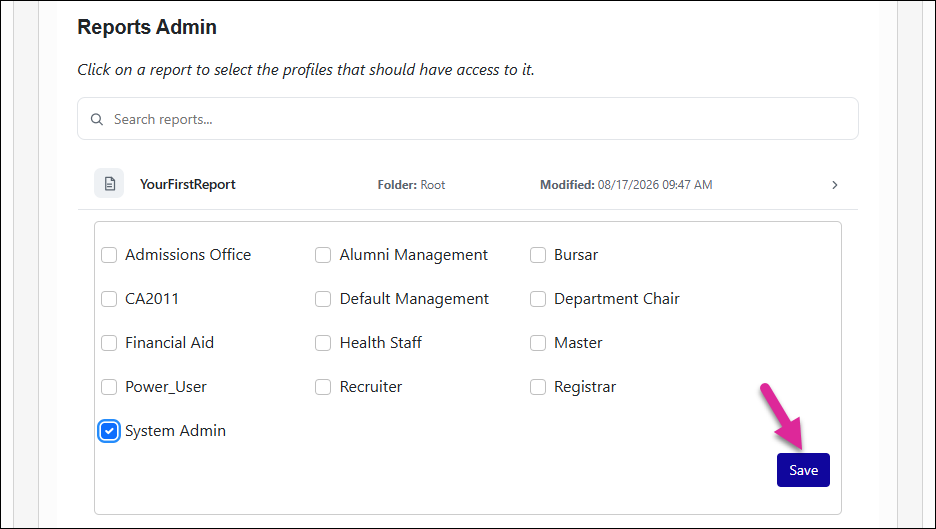
If you're logged in with a master profile, you'll see two additional buttons. The first, Reports Admin, takes you to another list of all the reports that users from your school have created in Telerik. Click on a report to open an access menu.
From the access menu, check the profiles that should have access to this report and click Save.
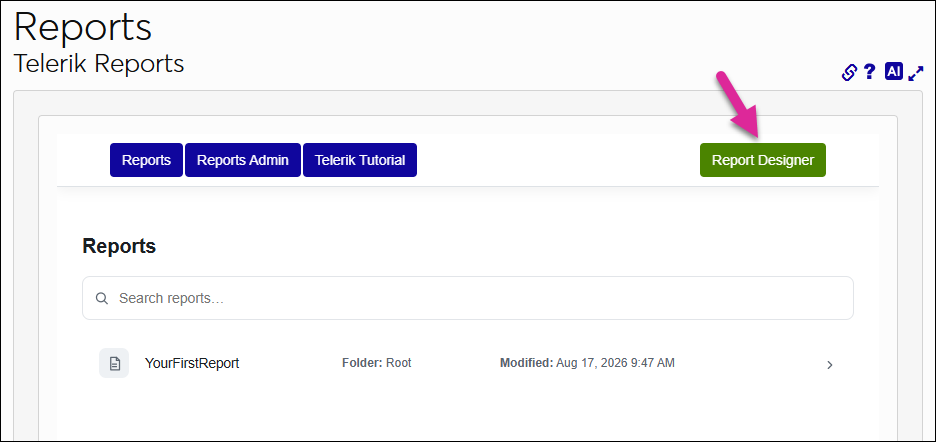
The final option is the Report Designer. Click this button to begin creating a report.
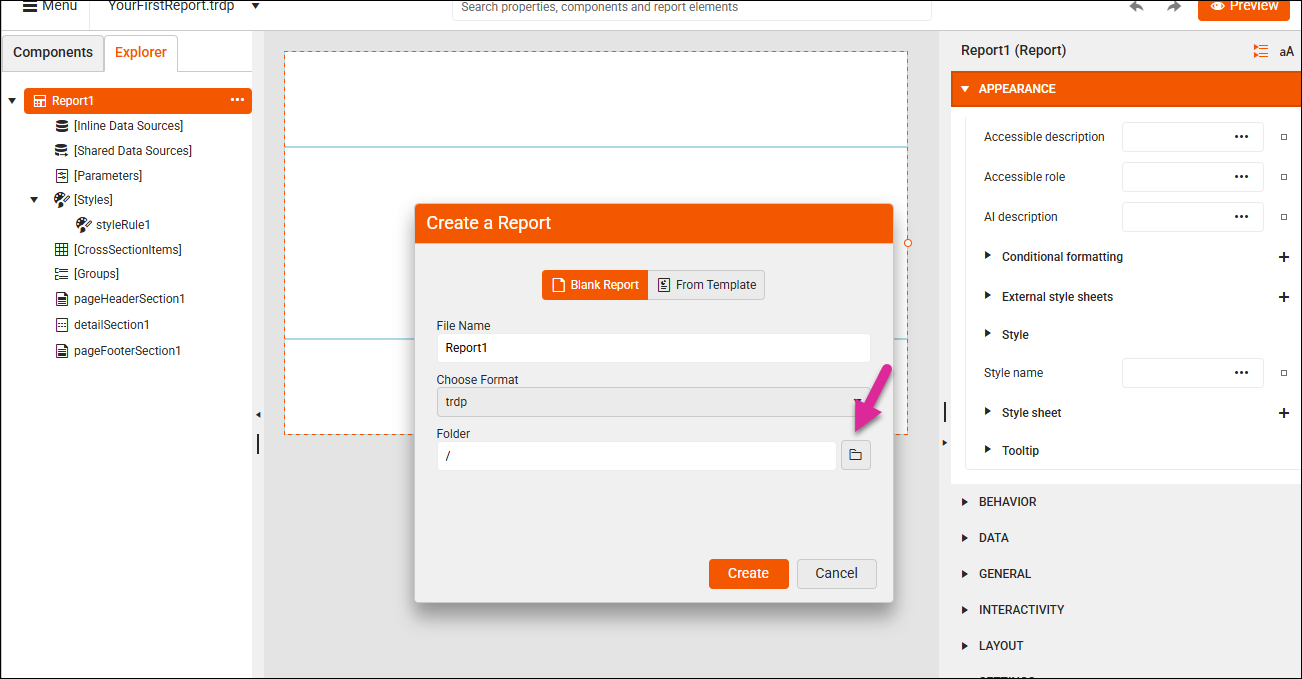
You can choose to create a Blank Report or start From Template if you've saved any templates in the past.
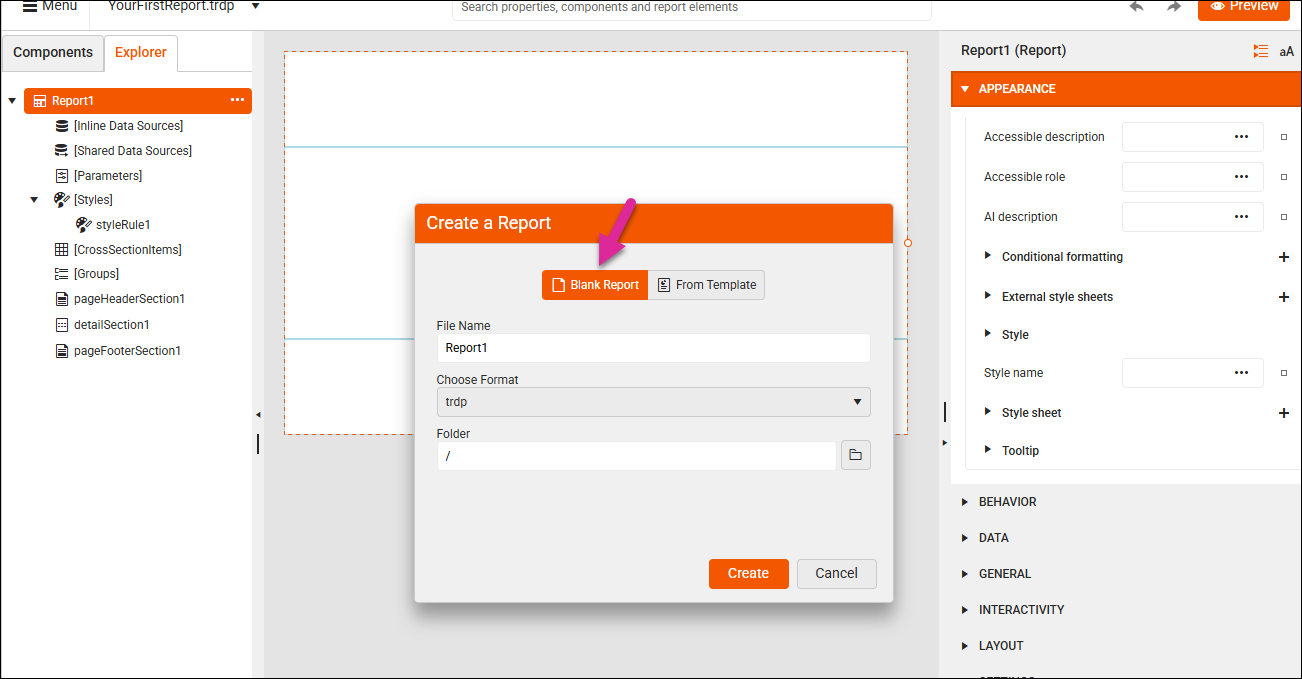
Click the folder icon to choose where your new report should be stored. You can create as many folders as you like and organize them based on the staff group who will need them or any other rubric that helps you organize them.
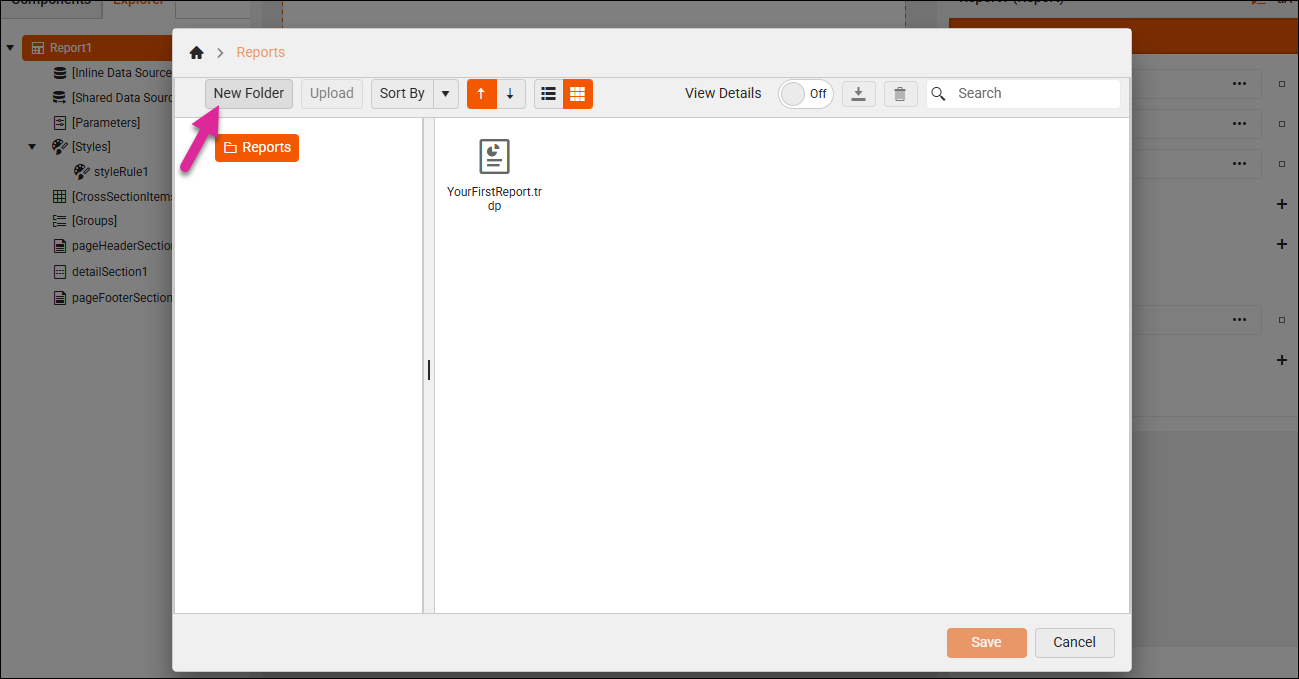
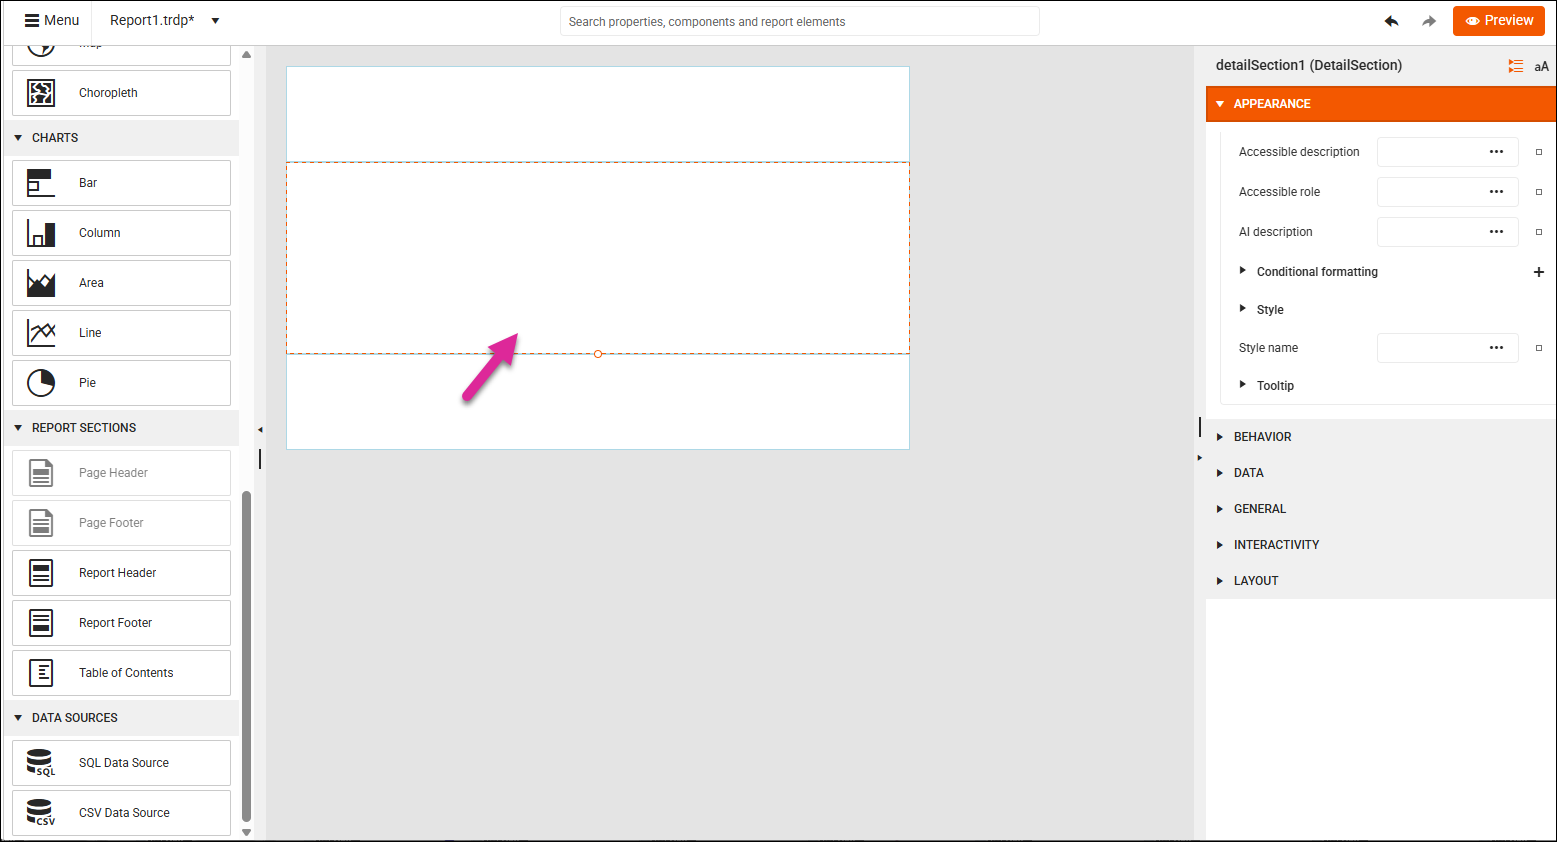
Once you've named your report and chosen a folder for it to live in, click on the dotted box in the middle of your screen. This is the canvas where you're building your report.
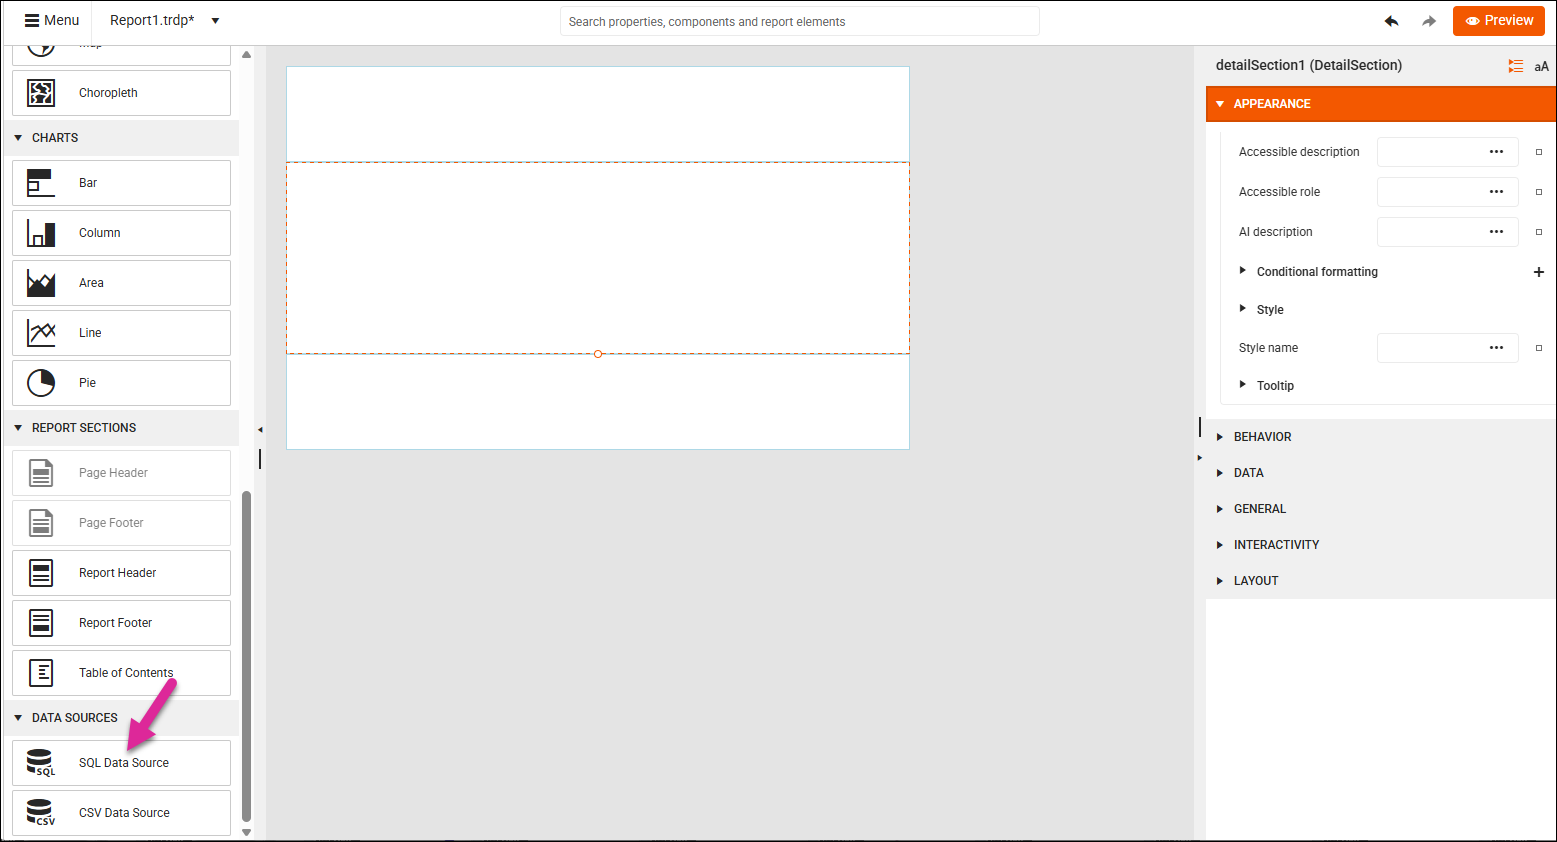
Scroll down and click SQL Data Source under the Data Sources tab.
Select SONIS as your data source. Click Next to continue and then Next again to share this connection.
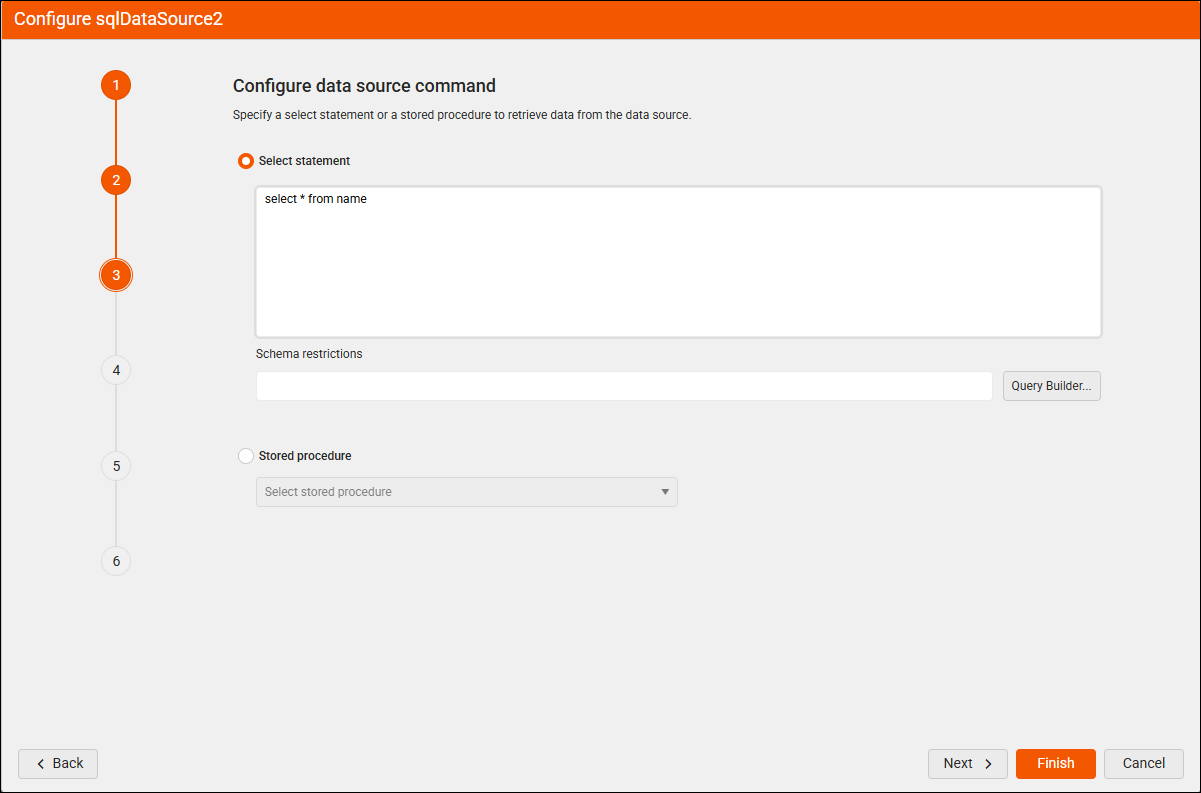
On step 3, enter an SQL select statement. This can be as simple as something like Select * from name. Alternately, you can write a more detailed query if you're familiar with SQL and our data structure and would like to start somewhere more specific.
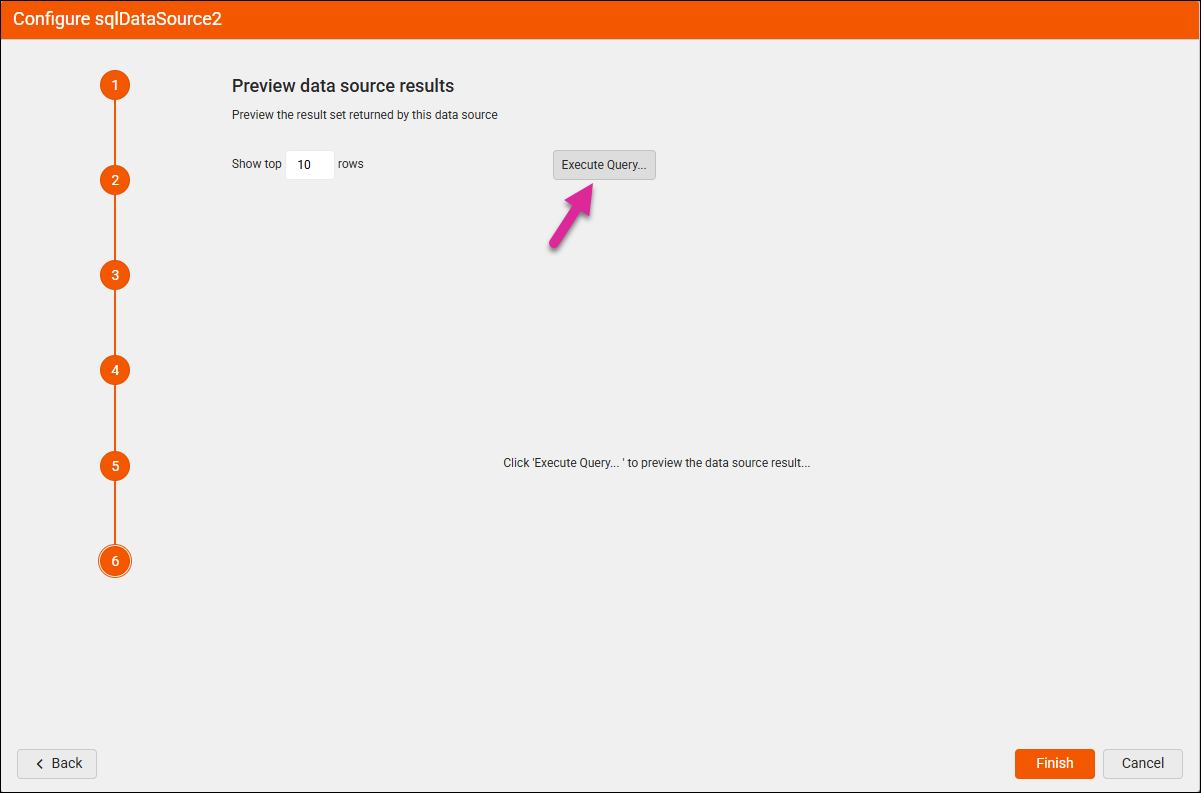
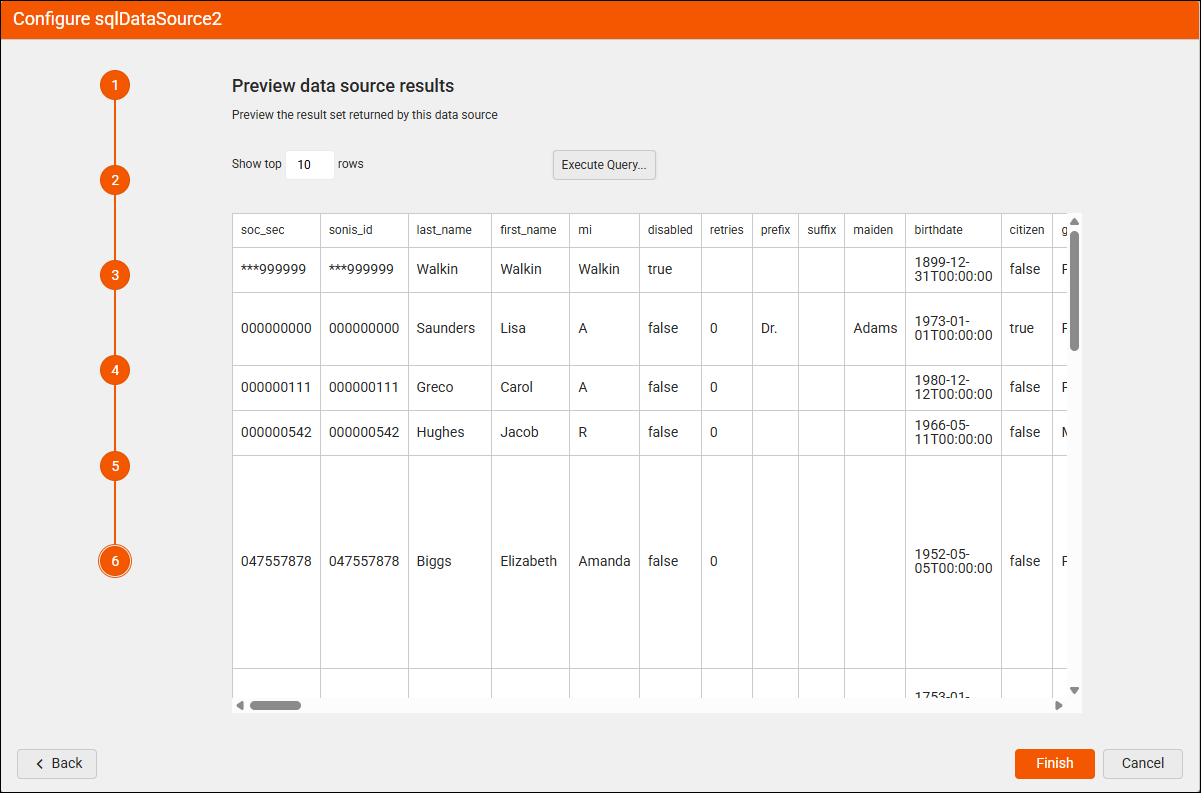
Click Next again. On step 6, you can click Execute Query to preview the data you're pulling in and make sure your select statement was formatted correctly.
Click Finish to return to your report and begin building.