Reports
Overview
This group of pages allows administrators to run reports covering things like attendance, financial aid, enrollment, prospective students, loans, etc. In addition to the stock reports listed here, clients can create their own reports using Query Builder, Query Builder 2, and Izenda. It's also possible for Jenzabar SONIS clients to create their own custom report files that would then be available through this menu once they're added to the system using Page Add/Edit. Contact your customer service manager for more information about this process.
Default report dates for the organization are set using the Report Date Range utility. These dates should be updated periodically to stay current.
Report Filters
Each report page has menus that can be used to filter the results. For example, you may want limit the report to a single campus or a single module status or even to a single individual. Once you have the proper filters in place to limit your report, click Build Report to view it.
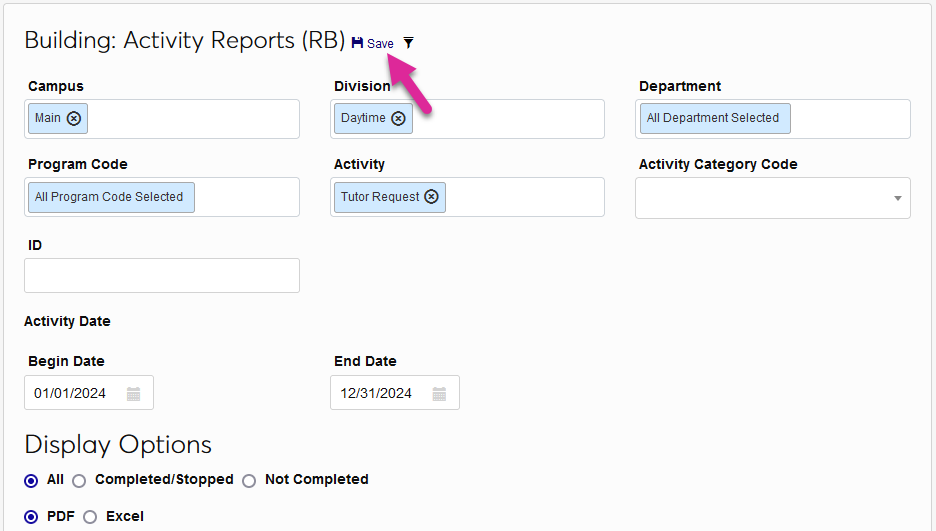
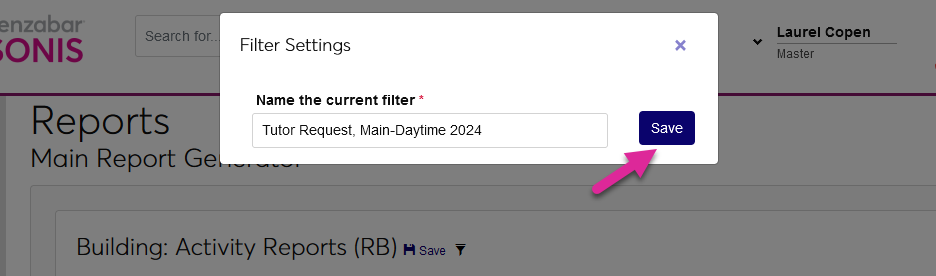
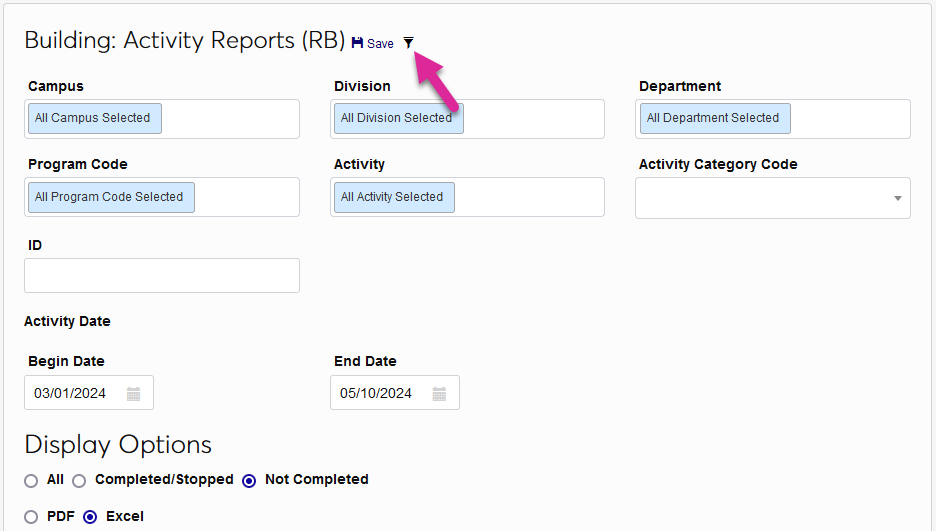
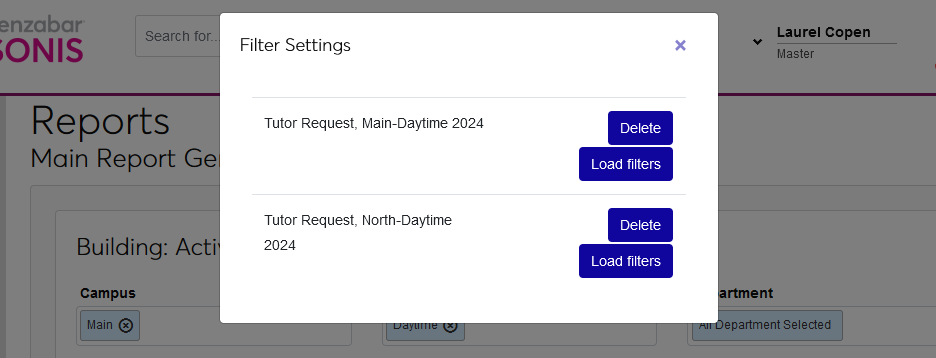
Some administrators may find that they use the same filters repeatedly to track the same thing over time. To prevent users from having to select the same filters again every time they return to the page, each report offers the option to save the current filters for later use. Once you've made your selections, simply click the Save button to create a custom filter that you can use again later. Provide a name for the filter and click Save again to complete the process.
To recall previously saved filter settings, click on the filter icon and then click Load Filters.
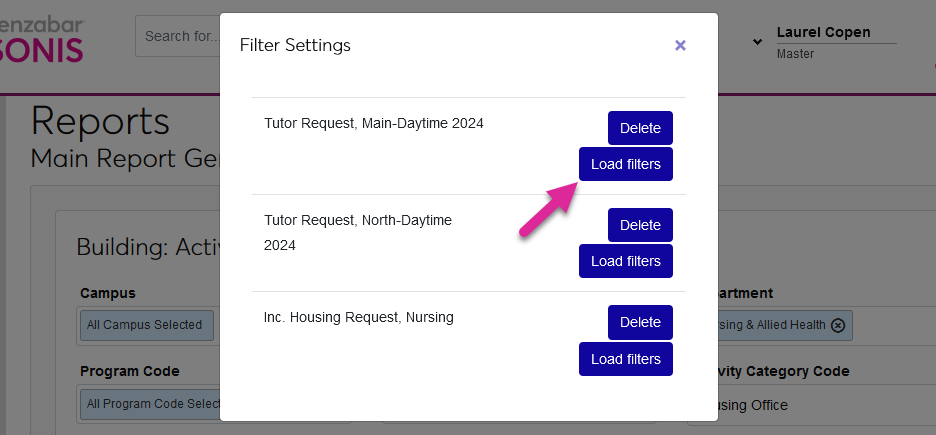
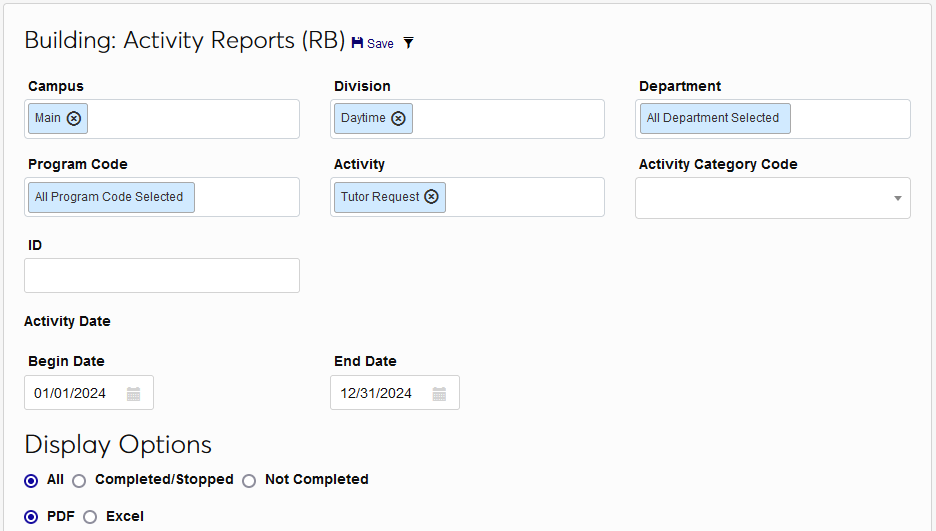
When the page reloads, all of the saved filters will be in place.
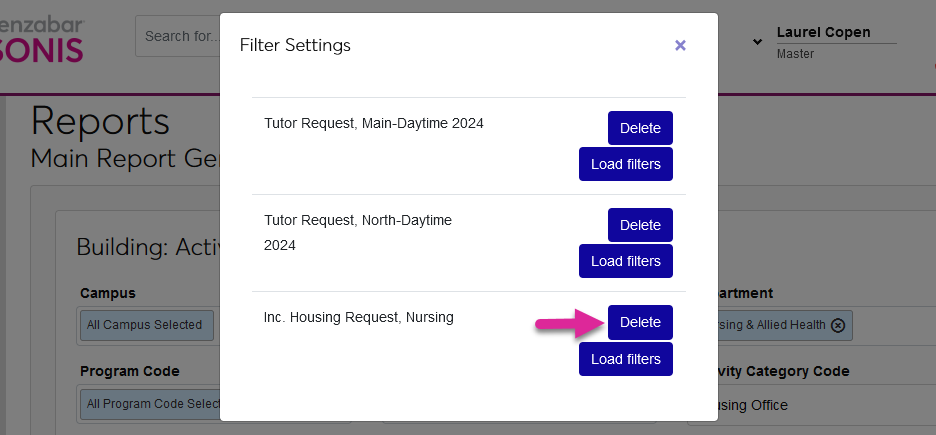
When a saved filter is no longer needed, click Delete to remove it.
Reports
This page is an ongoing project that will continue to be updated with more details. If documentation for a particular report is needed quickly, reach out to the institution's customer success manager (CSM) or Jenzabar Support.
Activities
Activity Report: Prospects
The Activity Report for Prospects displays Activities that were added to a prospects Records during the specified dates. The results can be filtered by Campus, Division, and/or Department as well as the Recruiter, Activity, and Activity Type. The report can also be set to display only Completed/Stopped activities, only Not Completed activities, or All activities. Users can input a single prospect's SONIS ID or view records for all students that fit the selected demographics. The report is organized by the activity. Available as a PDF or an Excel file.
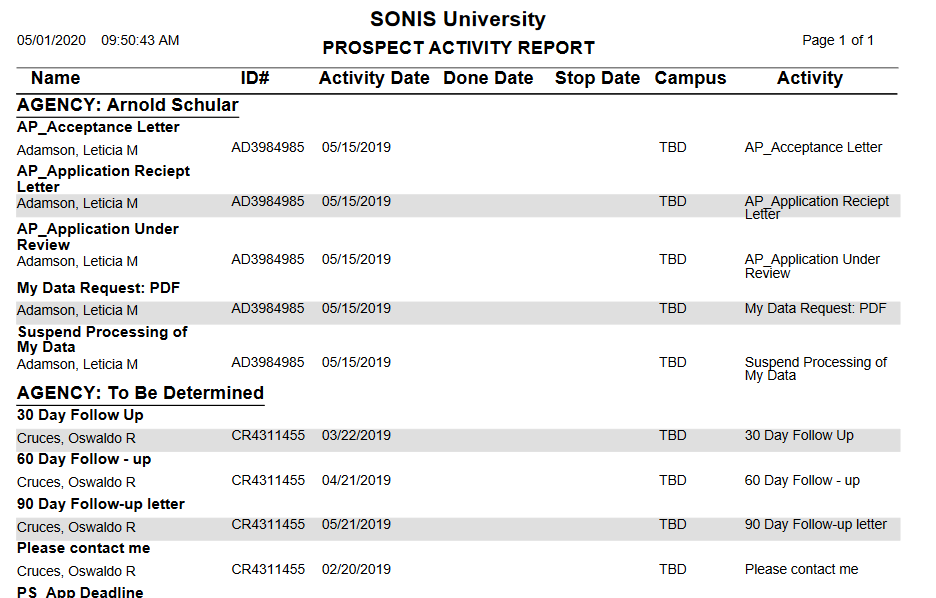
See Recruiting Plans for more information on how activity records for prospects are created.
Activity Reports
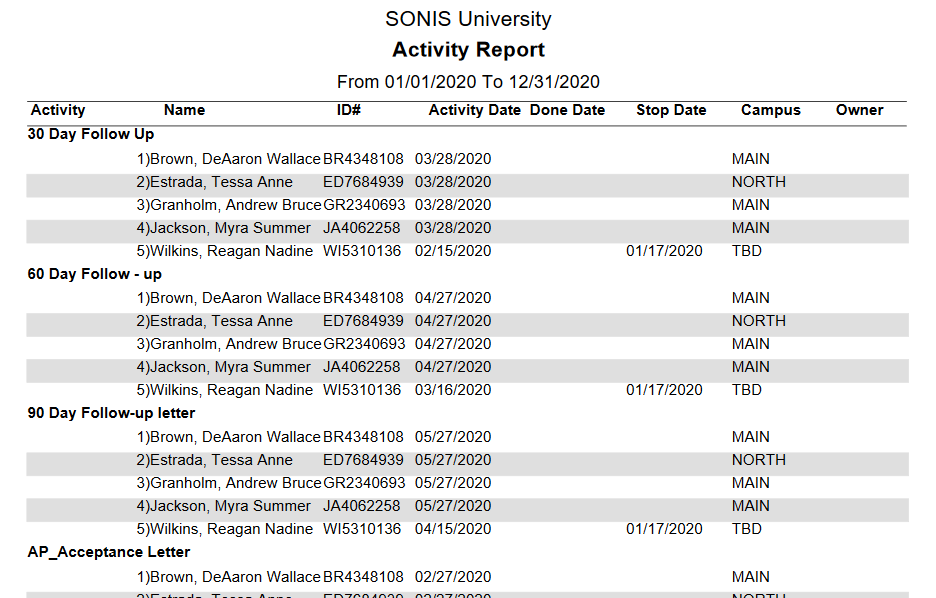
The Activity Report displays Activities that were added to a user's Records during the specified dates. It differs from the Activity Report: Prospects in that it displays results for users of all module statuses rather than simply prospects. The results can be filtered by Campus, Division, Department, and/or Program as well as the Activity and Activity Category. The report can also be set to display only Completed/Stopped activities, only Not Completed activities, or All activities. Users can input a single user's SONIS ID or view records for all students that fit the selected demographics. The report is organized by the activity. Available as a PDF or an Excel file.
Alumni
Alumni Alpha Listing
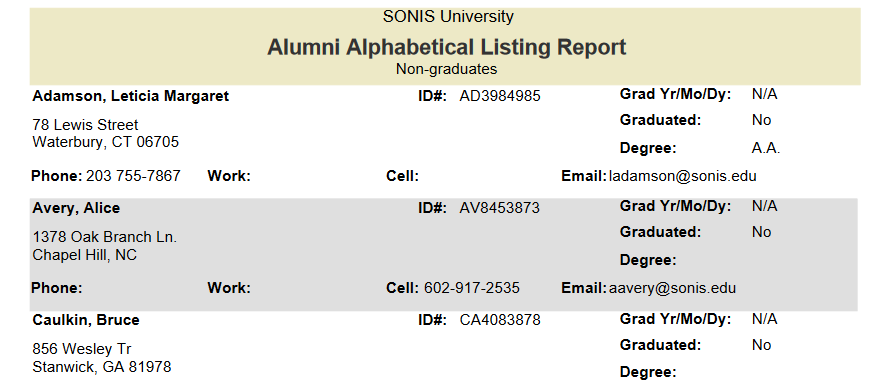
The Alumni Alpha Listing report provides an alphabetical list of the institution's alumni. The results can be filtered by Campus, Division, Department, and/or Program as well as by Graduation Month/Year. The report can display either Graduates or Non-graduates. A checkbox controls whether the report displays the user's Social Security number or leaves it off for security purposes. Available as a PDF or an Excel file.
Alumni Labels
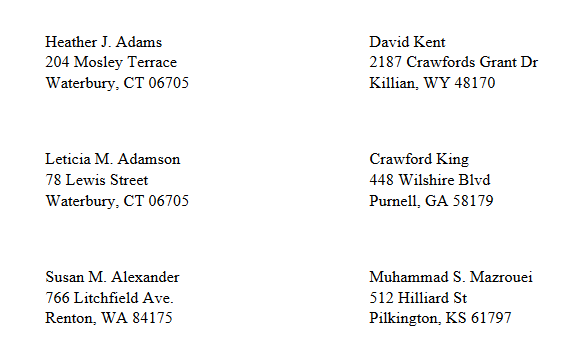
The Alumni Labels report is used to print mailing labels for contacting school alumni. The data comes from the user's from the user's Preferred address record. The results can be filtered by Campus, Division, Department, and/or Program as well as by Graduation Month/Year. The report can display either Graduates or Non-graduates. PDF only.
Alumni Mail Merge
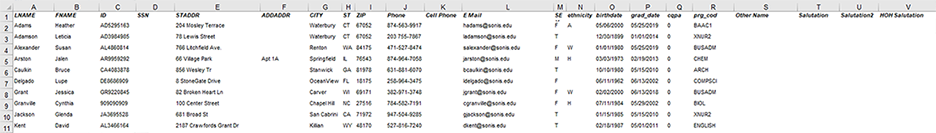
The Alumni Mail Merge report provides comprehensive alumni address information from the user's Preferred address record. The results can be filtered by Campus, Division, Department, and/or Program as well as by Graduation Month/Year and Graduation Date. The report can display either Graduates or Non-graduates. A checkbox controls whether the report displays the user's Social Security number or leaves it off for security purposes. Excel file only.
Alumni Profile
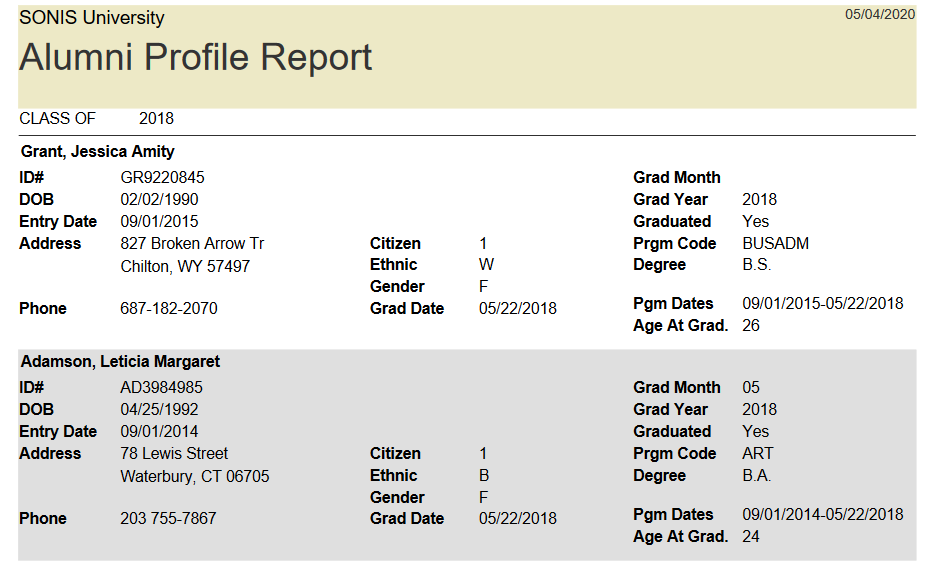
The Alumni Profile report displays a some basic facts about each alumnus and their time at the institution. The data comes from the user's Education record. The results can be filtered by Campus, Division, Department, and/or Program as well as by Graduation Month/Year. The report can display either Graduates or Non-graduates. Available as a PDF or an Excel file.
Alumni Survey
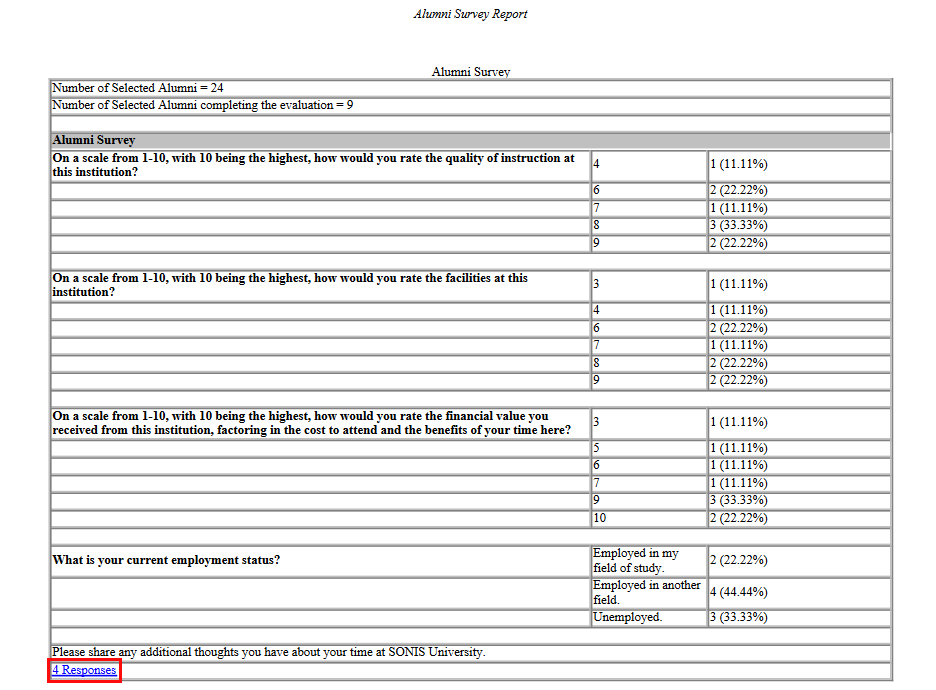
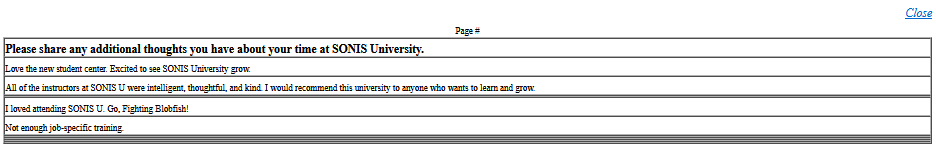
The Alumni Survey report displays the results of the survey given to school alumni. The results can be filtered by Campus, Division, Department, and/or Program as well as by Graduation Month/Year. Any evaluation with the evaluation type Alumni can be selected. The report displays a breakdown of the numerical responses to each question. If there are text answers included, the number of responses is listed as a link. Click this link to view individual responses.
Applicants
Note
Applicant reports only include users with a status of Applicant (AP) or Online Applicant (OA).
Admissions: OA Questions
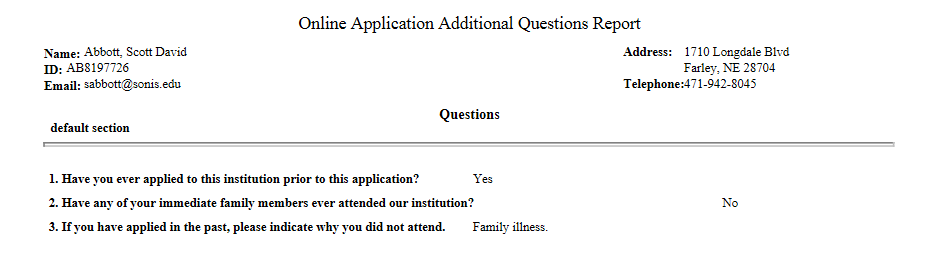
The OA Questions report displays student answers to questions from the Online Application. The results can be filtered by Campus, Division, and/or Department as well as by the Entry Date, the Entry Date range, and the completion status. An individual applicant can be selected by SONIS ID also. Available as a PDF or an Excel file.
Application Checklists (Missing Items)
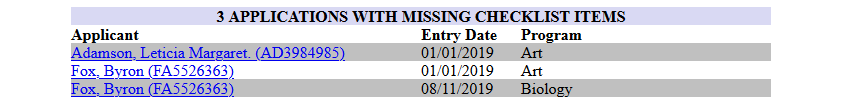
The App Checklists report displays every missing item from application checklists. The results can be filtered by Campus, Division, Department, Program, and/or Disposition as well as by the Term of Interest and the Entry Date. Available as a PDF or an Excel file.
Applicant ACT/SAT
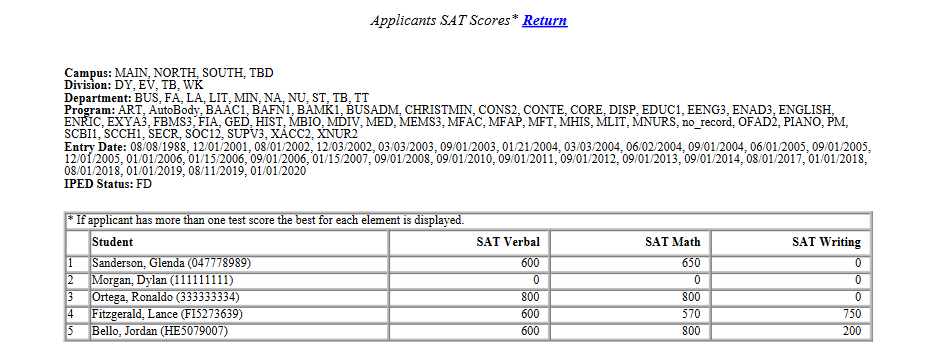
The Applicant ACT/SAT report displays the SAT and ACT scores of applicants. The results can be filtered by Campus, Division, Department, and/or Program as well as by the Entry Date and the IPEDS Status. Available as a PDF or an Excel file. PDF only.
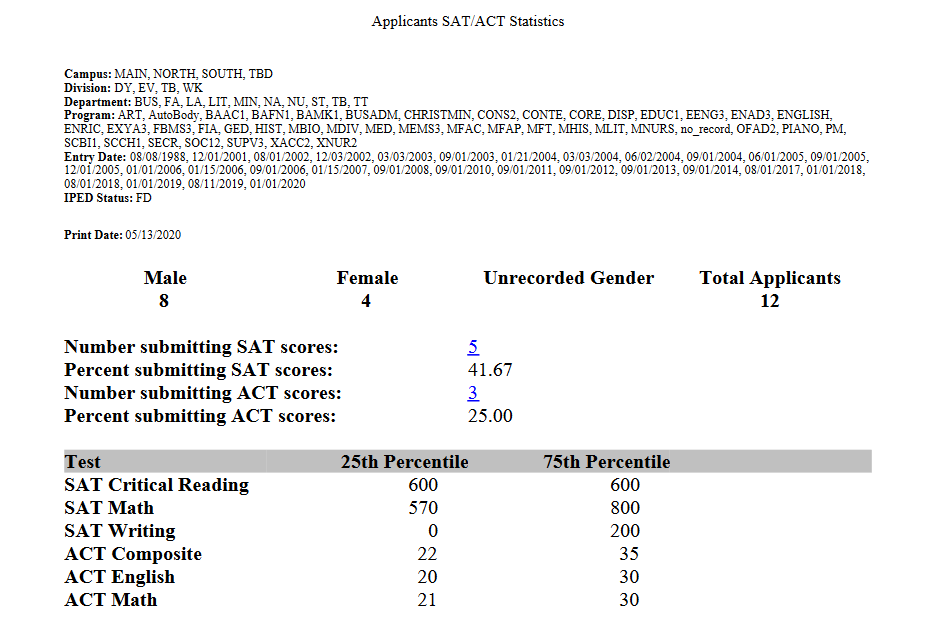
The Number submitting SAT scores and the Number submitting ACT scores are both links that, when clicked, display a list of the selected students.
Applicant Average GPA
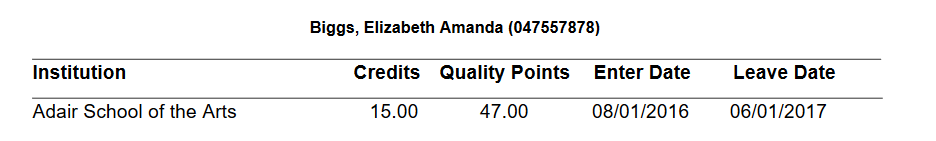
The Applicant Average GPA report displays the average GPA of applicants by Entry Date. The average GPA is calculated by dividing the applicant's Credits by their Quality Points. Only credits and quality points from previously attended institutions of higher learning are included. The results can be filtered by Campus, Division, Department, and/or Level. Available as a PDF or an Excel file.
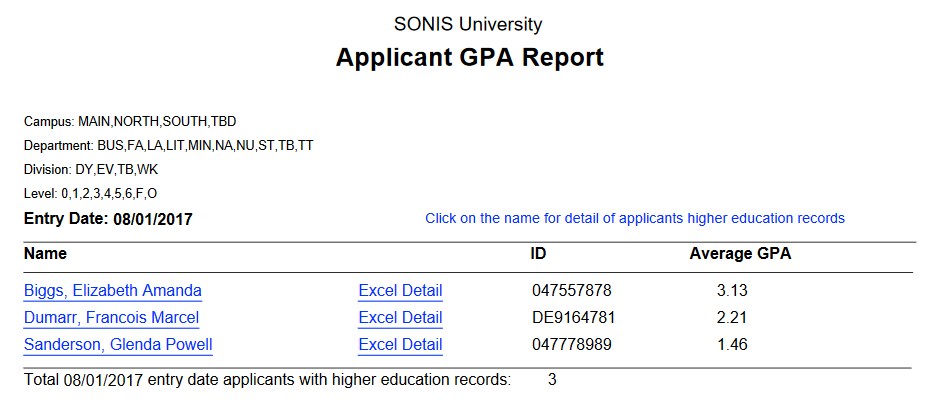
When viewing the file as a PDF, click on the student's name to view the breakdown of their GPA average or the Excel Detail link to open it as an Excel file.
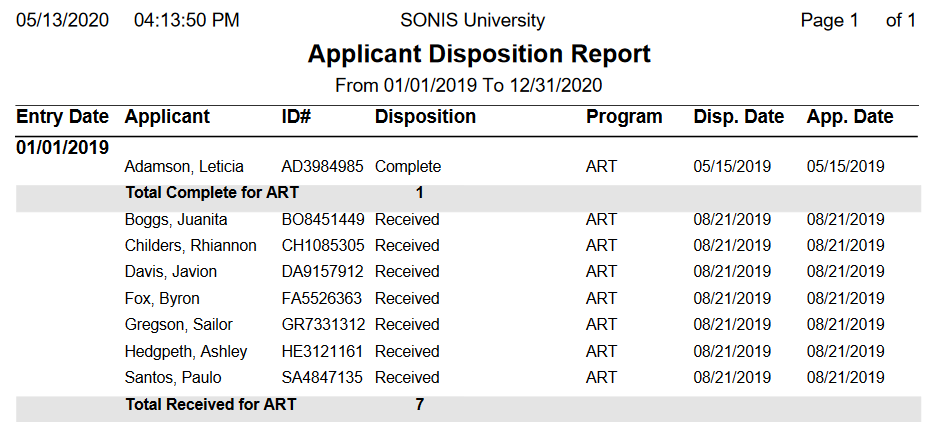
Applicant Disposition
The Applicant Disposition report displays all current dispositions for users with an applicant status. The results can be filtered by Campus, Division, Department, Program, and Disposition as well as by the Entry Date range. The report is sorted by program and disposition. Available as a PDF or an Excel file.
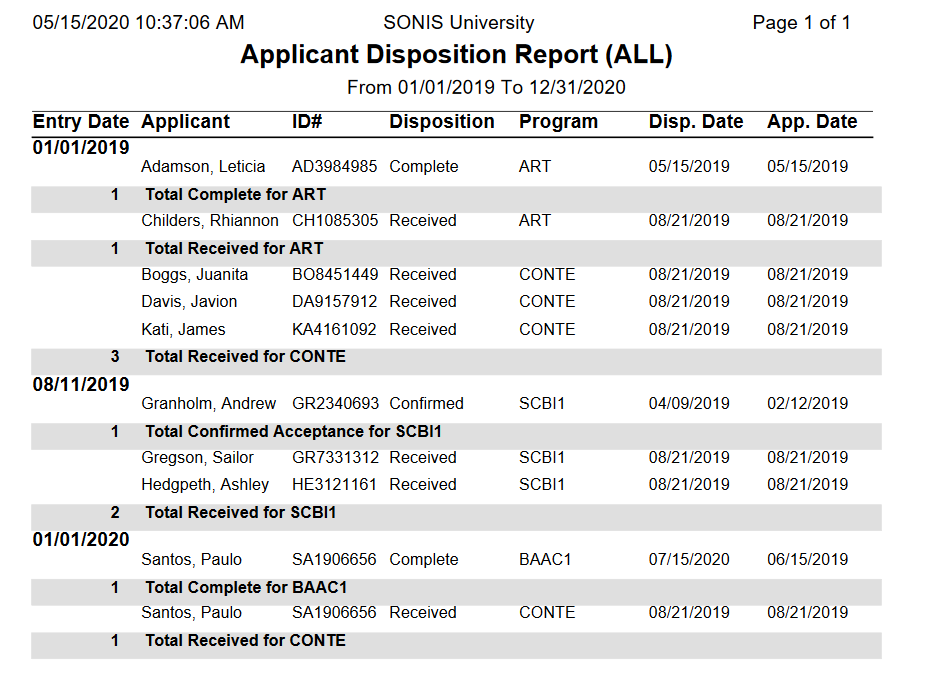
Application Dispositions, All
The Applicant Disposition ALL report displays all dispositions for users with an applicant status regardless of whether they're current or not. The results can be filtered by Campus, Division, Department, Program, and Disposition as well as by the Entry Date range. The report is sorted by program and disposition. Available as a PDF or an Excel file.
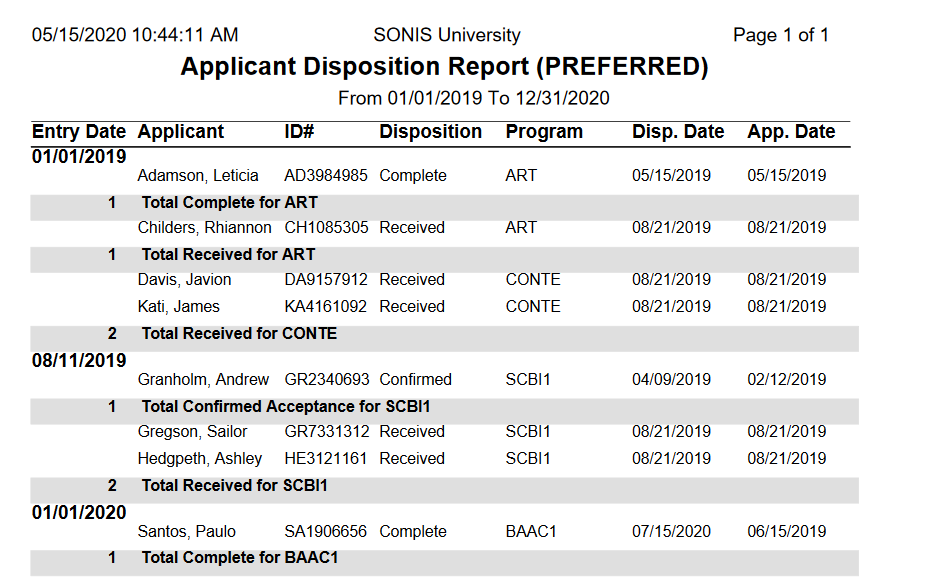
Applicant Dispositions, Preferred
The Applicant Dispositions Preferred report displays only current dispositions that are associated with preferred applications/programs. You can set which programs are designated as prefered from the Application Users page or the applicants can set their preferred program themselves from the Bio page of the Applicant portal.The results can be filtered by Campus, Division, Department, Program, and Disposition as well as by the Entry Date range. The report is sorted by program and disposition. Available as a PDF or an Excel file.
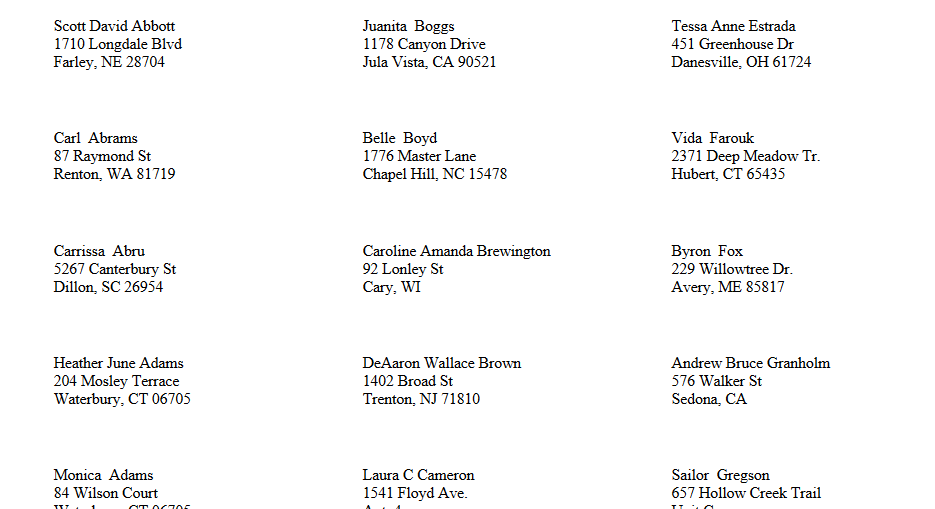
Applicant Labels
The Applicant Labels report allows schools to print mailing labels for their applicants. The results can be filtered by Campus, Division, Department, Program, and Disposition as well as by Recruiter, Entry Date, and the Application Date range. PDF only.
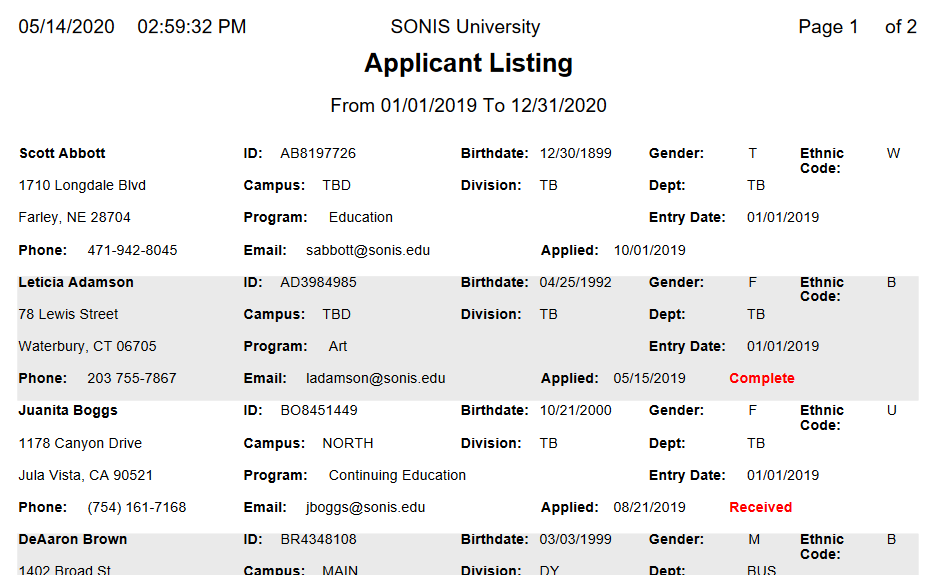
Applicant Listing
The Applicant Listing report provides address and education records for applicants. The results can be filtered by Campus, Division, Department, Program, and Disposition as well as by Recruiter, Entry Date, and the Application Date range. The report is sorted by alphabetically. Available as a PDF or an Excel file.
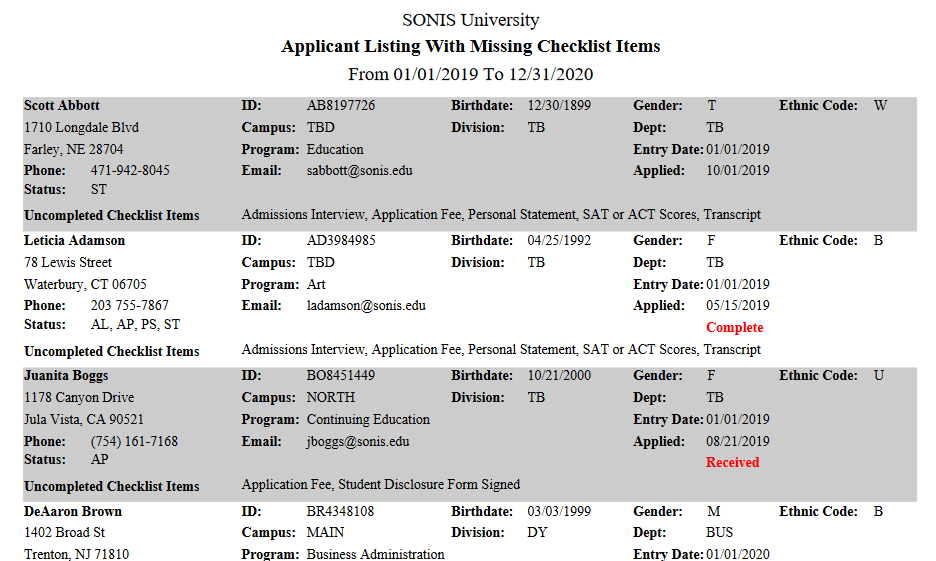
Applicant Listing with Checklist
The Applicant Listing With Checklist report provides address and education records for applicants along with a list of their uncompleted Application Checklist items. The results can be filtered by Campus, Division, Department, Program, and Disposition as well as by Recruiter, Entry Date, and the Application Date range. PDF only.
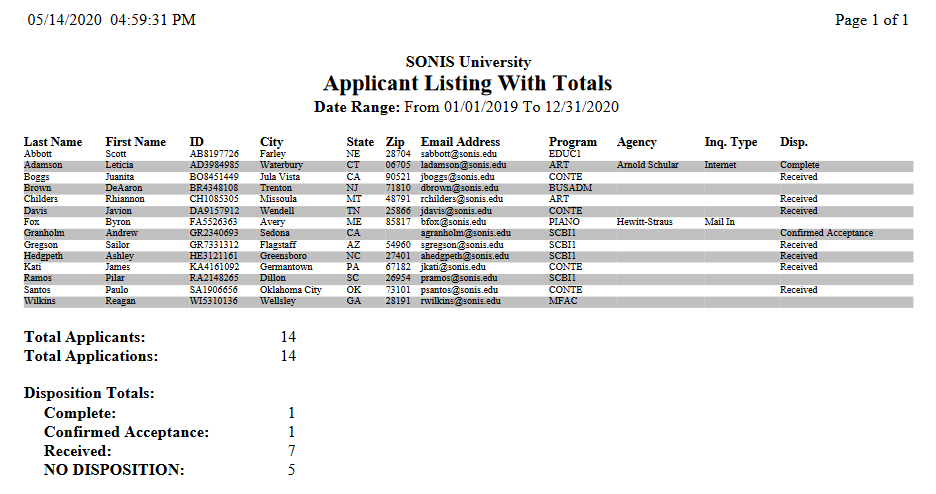
Applicant Listing with Totals
The Applicant Listing With Totals report provides basic address and education information about applicants along with the total number of applicants for each disposition. The results can be filtered by Campus, Division, Department, Program, and Disposition as well as by Recruiter, Entry Date, and the Application Date range. Available as a PDF or an Excel file.
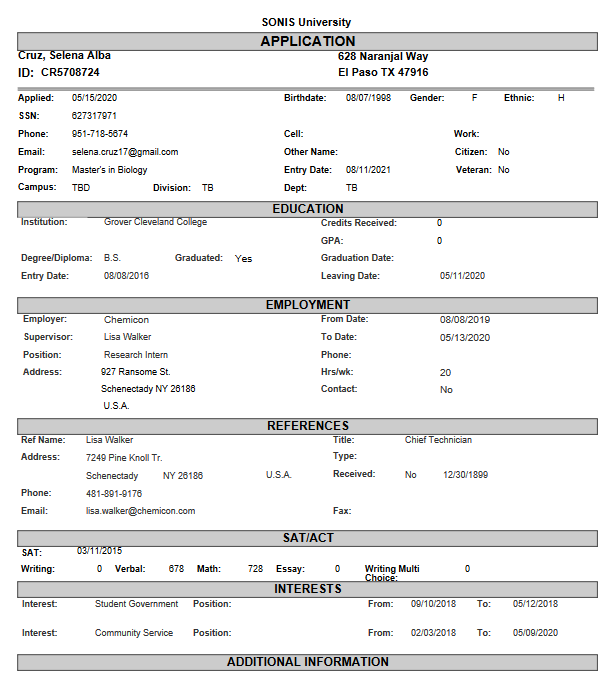
Application
The Application report displays the data submitted in the SONIS Online Application. The results can be filtered by Campus, Division, Department, Program, and Disposition as well as by Entry Date and the Application Date range. Administrators can also select a single student using the ID field. The entire application is displayed. One applicant per page. PDF only.
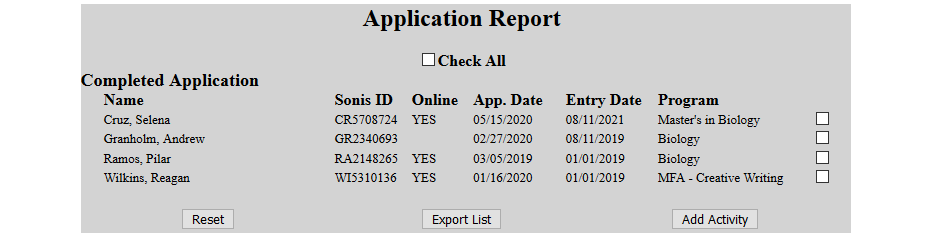
Application Status Report
The Application Status Report displays the status of applications that have been imported to the SONIS system, listing them as either Complete or Incomplete. The results can be filtered by Campus, Program, Entry Date, and the Application Start Date range. Displays as a web report page.

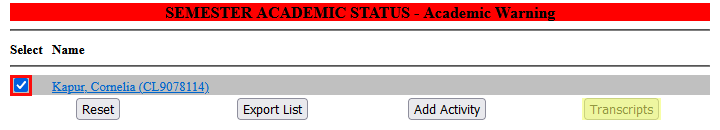
Click on one of the numbers to view a list of the applications in that category. From the list page, administrators can add an activity to one or more applicant's records or export entries as an Excel file.
Applications by State/City/Zip
The Applications by State/City/Zip report displays the data submitted in the SONIS Online Application in a pie chart listing the states where applicants are located. The results can be filtered by Campus, Division, Department, Program, Entry Date, and IPEDS Status. Displays as a web report page.
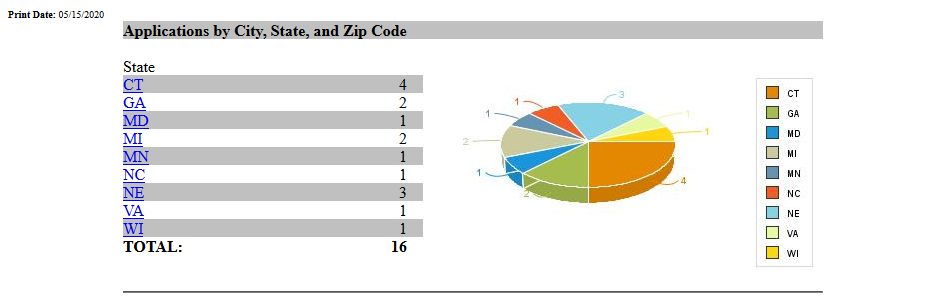
Click on a state to view a breakdown of cities included in that total and a city on the following page to see a the zip codes.
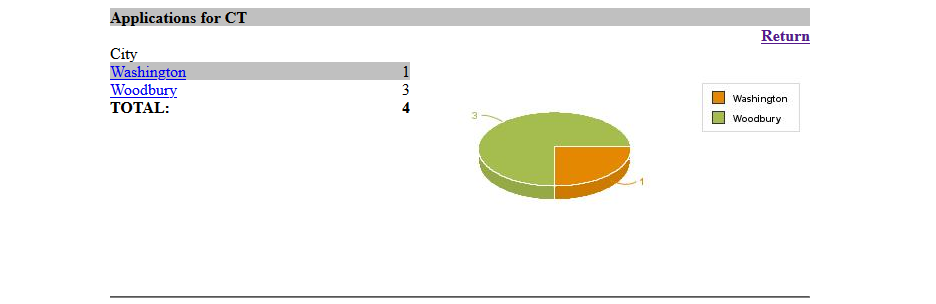
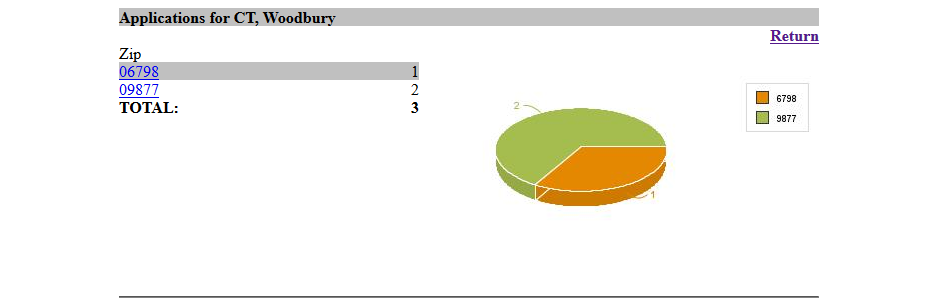
On the zip code breakdown page, click on a zip code to view the applicant data.

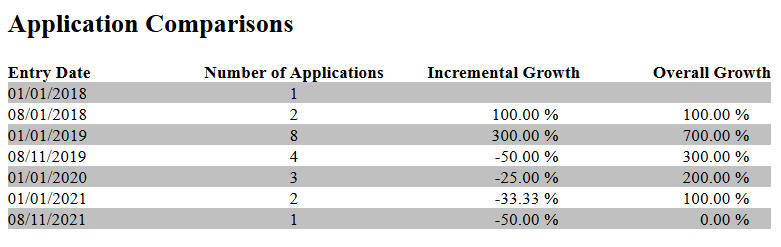
Applications Comparison
The Applications Comparison report provides a breakdown of the number of applications by entry date and the growth or decline in applications implied by those figures. The results can be filtered by Campus, Division, Department, and Entry Date. Displays as a printable web report.
Attendance
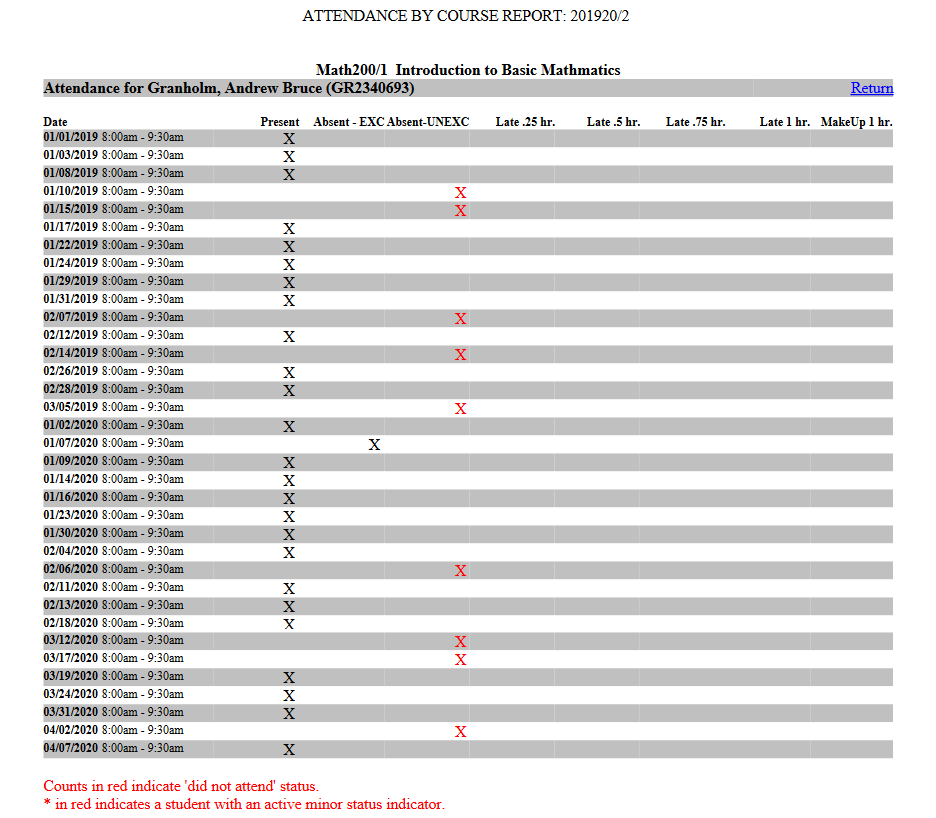
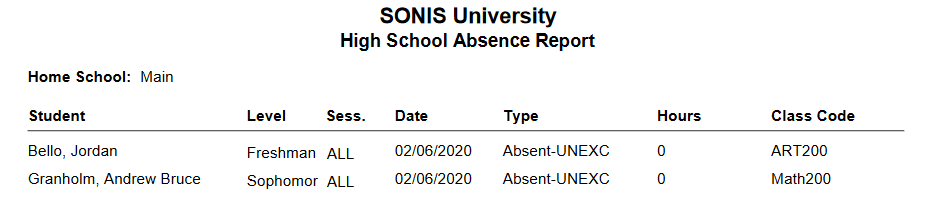
Absence Attendance by Course
The Absence Attendance by Course report displays student absences sorted by course. The report can be filtered by Campus, Division, Department, Program, and Level. It returns results from one School Year and Semester at a time. A checkbox allows administrators to choose whether to display all courses or to Select Course Section. PDF only.
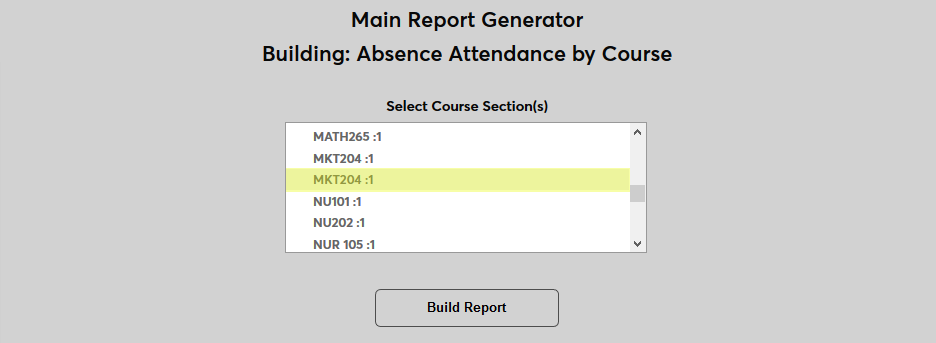
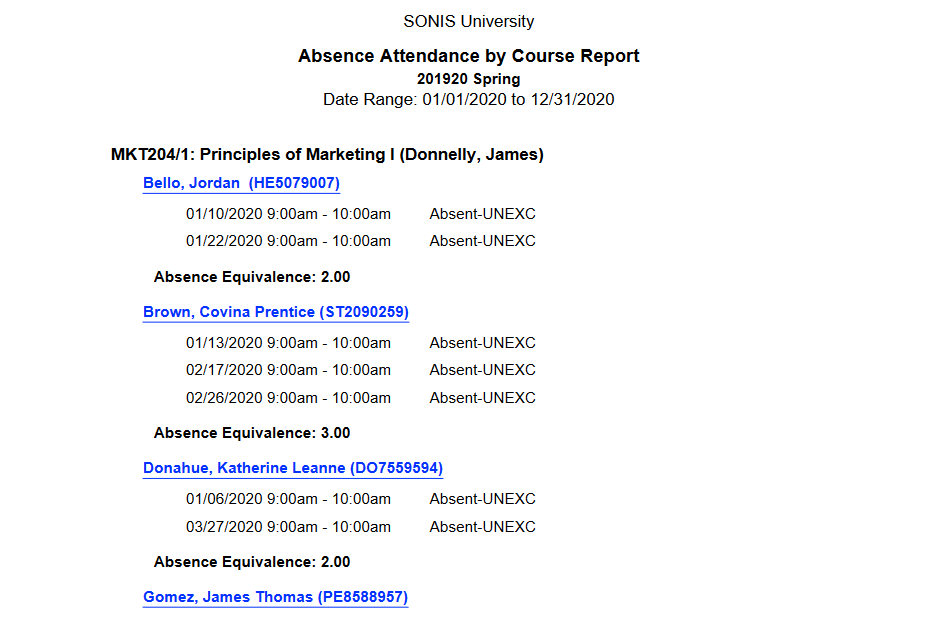
Each student's name is displayed as a link. Clicking the link will open a page that shows just that student's absences for the selected course.
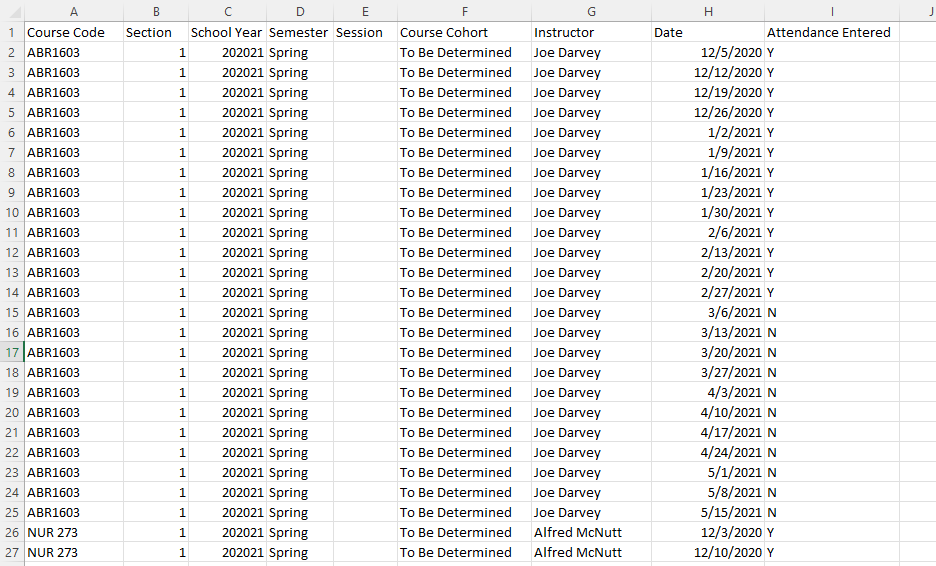
Attendance by Instructor
The Attendance by Instructor report is used to determine which instructors have entered attendance for specific dates and which instructors have not yet entered attendance. The report can be filtered by Campus, Division, Department, School Year, and Semester. A checkbox is included to allow administrators to Exclude Days with Attendance Recorded so administrators can quickly locate missing attendance records. CSV only.
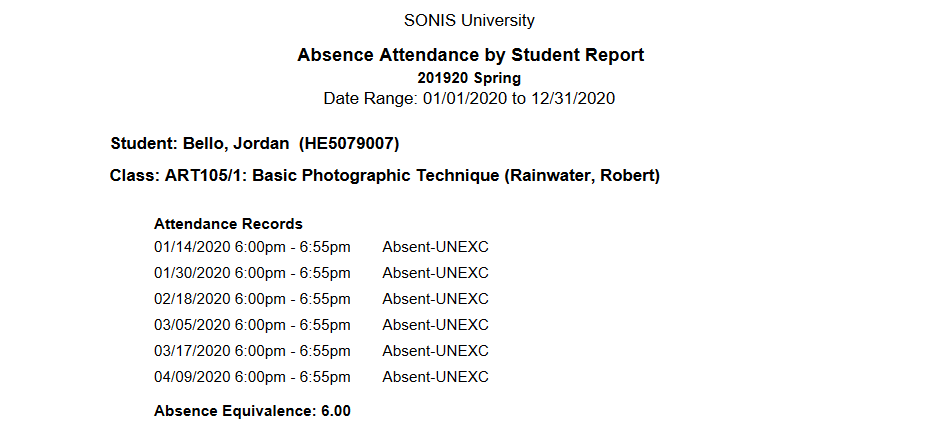
Absence Attendance by Student
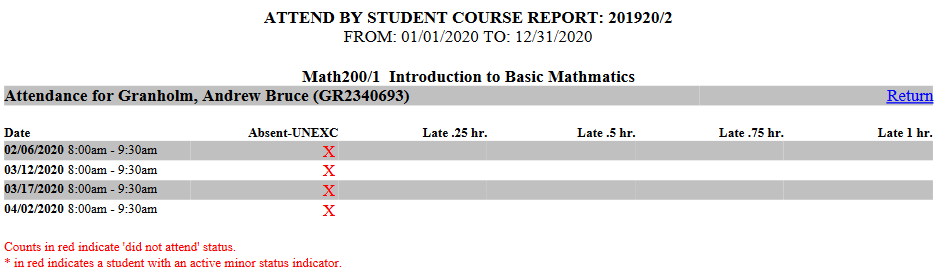
The Absence Attendance by Course report displays student absences sorted by student and course. The report can be filtered by Campus, Division, Department, Program, and Level. It returns results from one School Year and Semester at a time. An ID field is included to allow a single student to be selected using their SONIS ID. The report displays one student/course per page. PDF only.
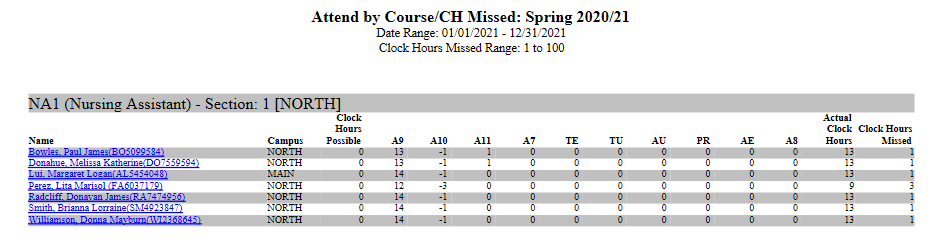
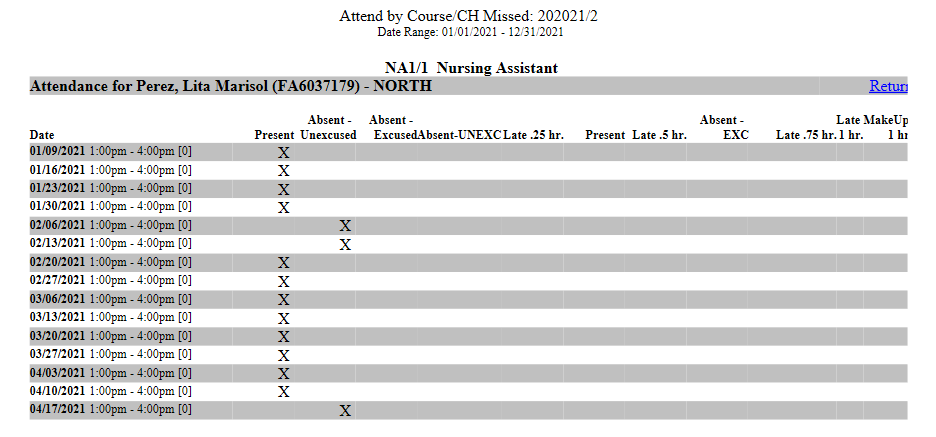
Attendance by Course/Clock Hours Missed
The Attend by Course/CH Missed report displays student clock hours missed by course. The report can be filtered by Campus, Division, Department, and Level. It returns results from one School Year and Semester and one Course Type at a time and within a specified Date Range. The user must also select a range of hours missed with the From and To fields. Users can choose to Select Course Section(s) or leave this box unchecked to view all sections that fit the selection criteria. PDF only.
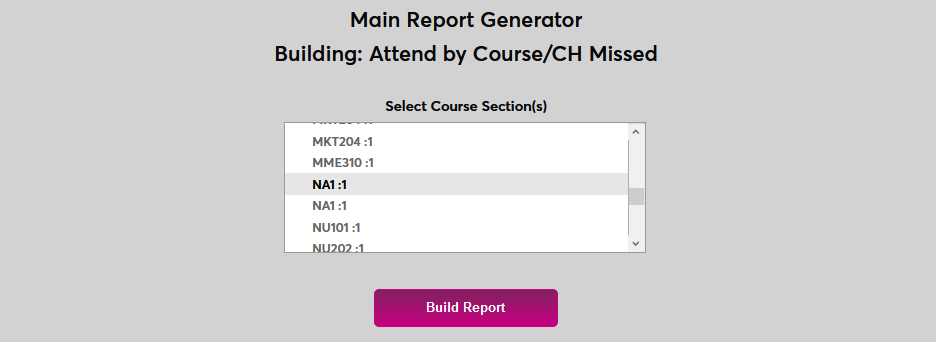
Users can drill down on a specific course and a specific student to see more details.
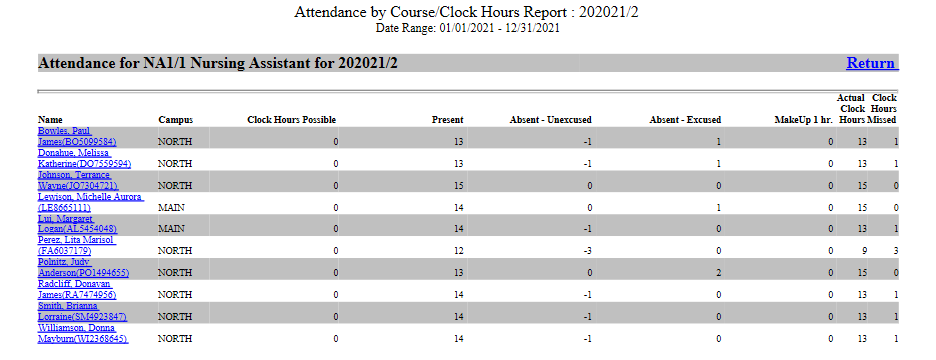
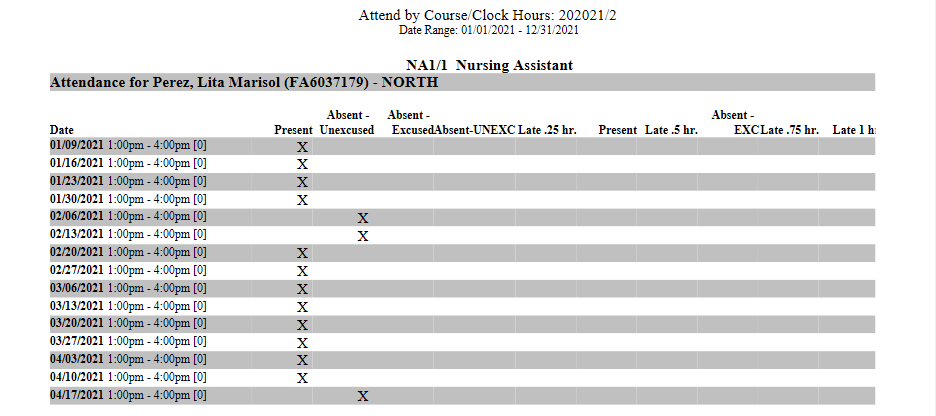
Attendance by Course/Clock Hours
The Attend by Course/Clock Hours report displays student attendance by course based on clock hours. The report can be filtered by Campus, Division, Department, and Level. It returns results from one School Year and Semester at a time and within a specified Date Range. An optional checkbox is included that allows administrators to Select Course Section(s) to display. PDF only.
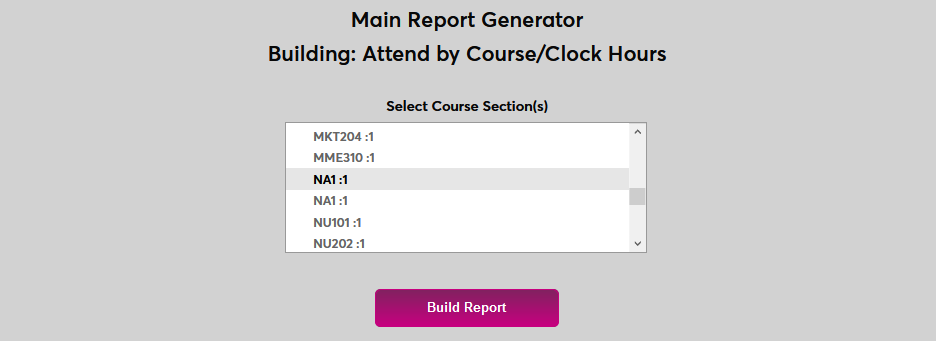
Users can drill down on a specific course and a specific student to see more details.

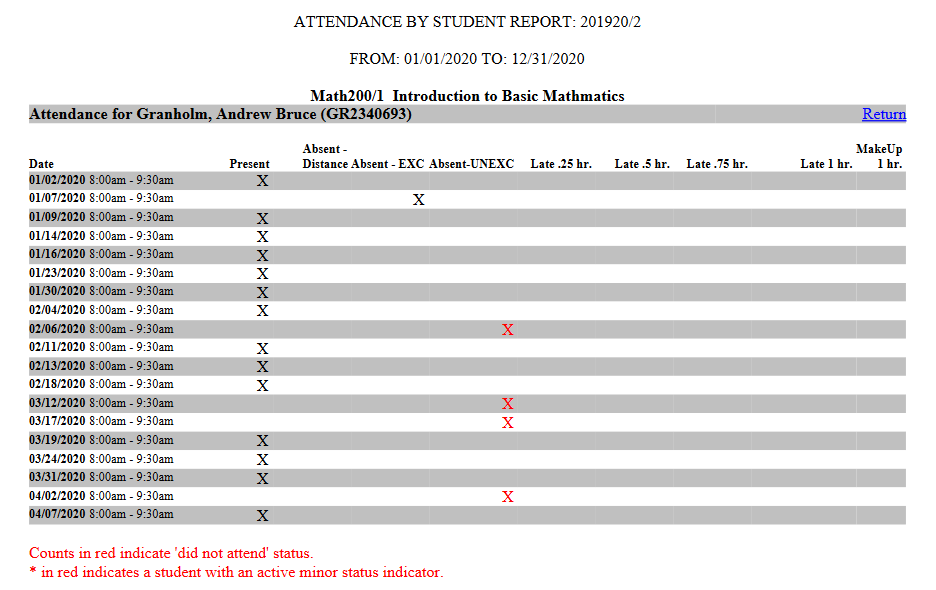
Attendance by Student Course
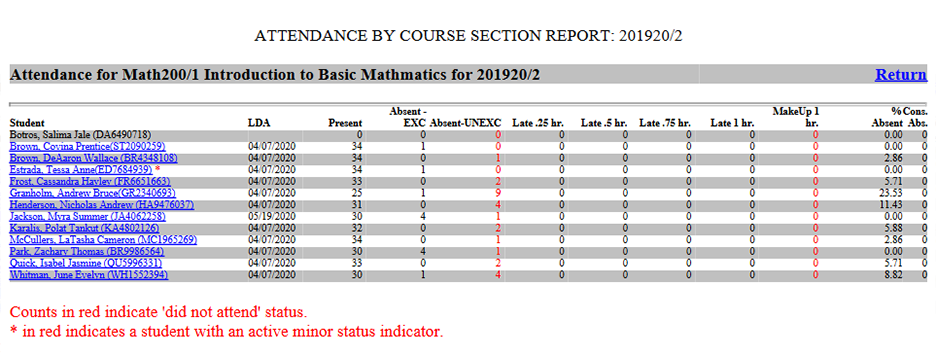
The Attend by Student Course report displays student attendance sorted by course. The report can be filtered by Campus, Level, and Course Type as well as by the Attendance Caption and the Attendance Date Range. It returns results from one School Year and Semester at a time. An ID field is included to allow a single student to be selected using their SONIS ID. A checkbox is included to Exclude Present on Final Drilldown. If checked, the report shows only absence attendance captions when displaying individual students. Available as a PDF or an Excel file.
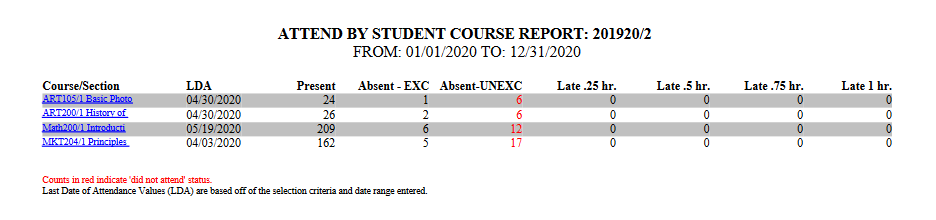
From the summary page, click on the Course/Section name to view the attendance records of the section.
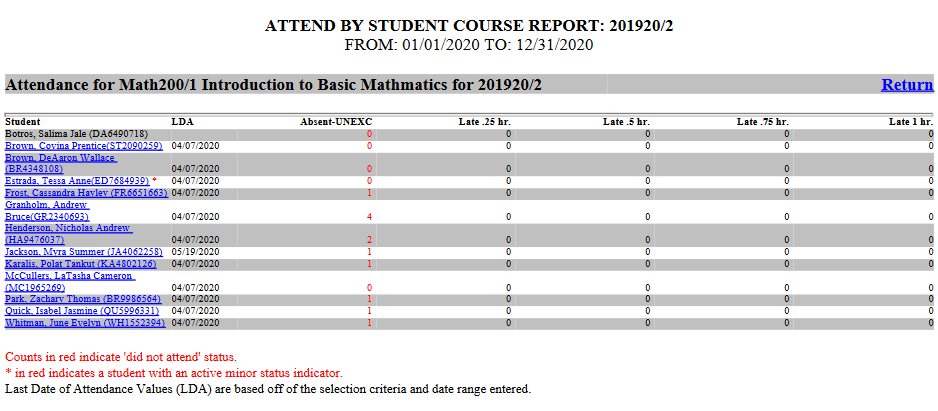
Click on a student's name to drill down further and see that student's attendance record for the section.
Attendance Summary by Student/Clock Hours
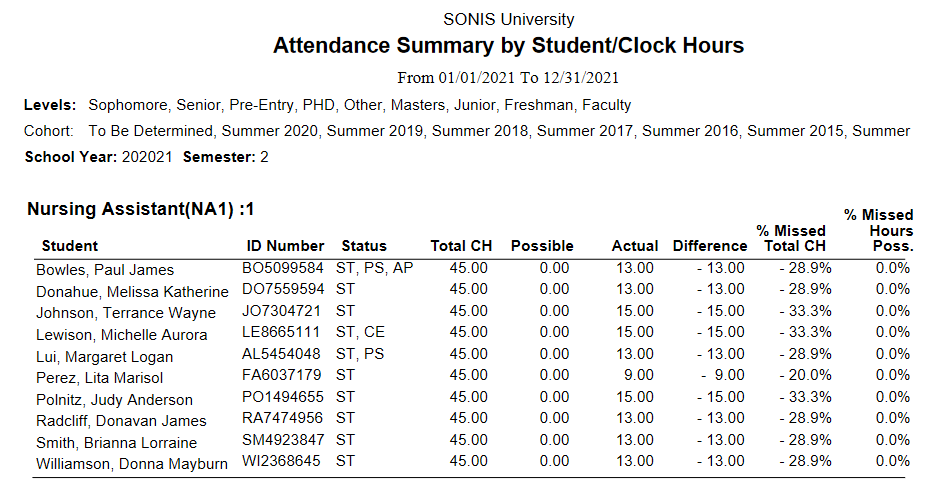
The Attendance Summary by Student/Clock Hour displays student clock hours. The report can be filtered by Campus, Division, Department, and Level. It returns results within a specified Attendance Date Range. Available as a ColdFusion report or an Excel file.
Attendance by Student/Clock Hours by Course Section
The Attend by Course/CH Missed report displays student clock hours missed by course section. The report can be filtered by Campus, Division, Department, Cohort, and Level. It returns results from one School Year and Semester at a time and within a specified Date Range. Users can choose to Select Course Section(s) or leave this box unchecked to view all sections that fit the selection criteria. PDF only.
Attendance by Course
The Attendance by Course report displays attendance sorted by course. The report can be filtered by Campus, Division, Department, and Level. It returns results from one School Year and Semester at a time. A checkbox is included to allow administrators to Select Course Section(s) to be included in the report. PDF only.
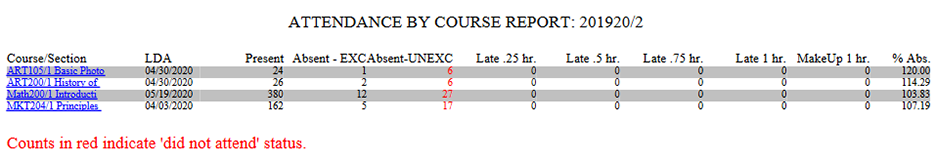
Click on a Course/Section to view attendance records for that section.
Click on the name of a student to view that student's attendance records for the course section.
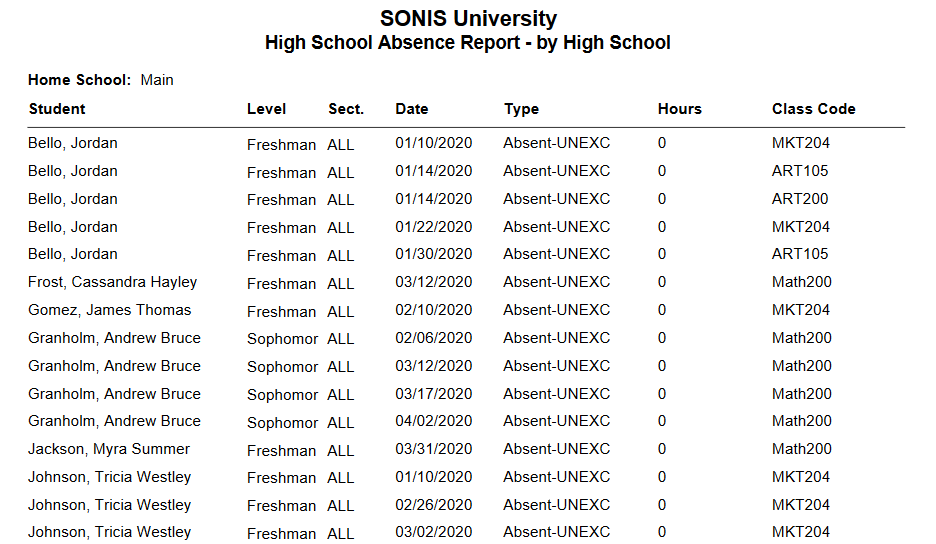
Attendance by High Schools
The Attendance by High Schools report displays student attendance sorted by high school. The report is designed for schools that enter student high schools as a Campus. It can be used as an attendance by campus report for institutions that don't deal with high schools in this manner. The report can be filtered by Campus, Division, Department, and Level. It returns results from one School Year and Semester at a time. Administrators can choose to include AM Sections, PM Sections, or All Sections in the report. PDF only.
Attendance by Student
The Attendance by Student report displays attendance with one student per page. The report can be filtered by Campus, Division, Department, and Level along with a date range. It returns results from one School Year and Semester at a time. Administrators must choose a number of Consecutive Absences Greater Than and/or an Absence Percentage Greater Than to display. At least one of these fields must be used. Administrators can also choose whether or not to include withdrawn students. Check the Exclude Withdrawn box to exclude these students. An ID field is included to allow a single student to be selected using their SONIS ID. PDF or Excel available.
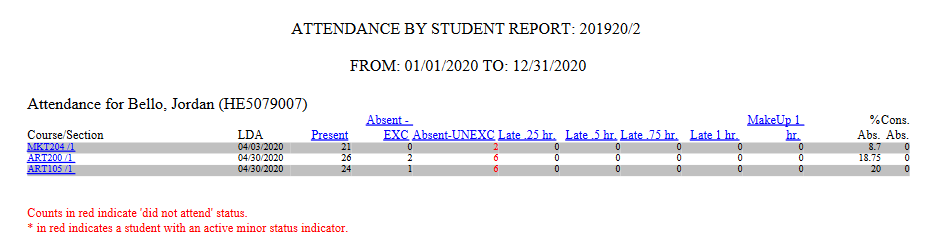
Click on a Course/Section to view the student's attendance record for that section.
Attendance for High Schools
The Attendance for High Schools report displays student absences sorted by high school and date. The report is designed for schools that enter student high schools as a Campus. It can be used as an attendance by campus report for institutions that don't deal with high schools in this manner. The report can be filtered by Campus, Division, Department, and Level along with a Date Range. It returns results from one School Year and Semester at a time. Administrators can choose to include AM Sections, PM Sections, or All Sections in the report. PDF only.
Miscellaneous "A" Reports
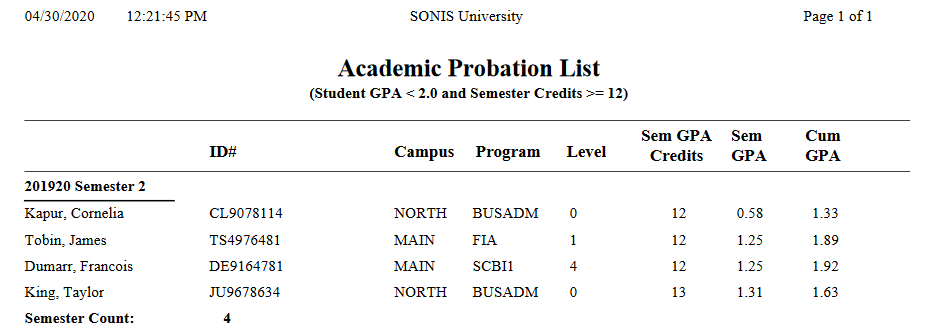
Academic Probation
The Academic Probation report displays students who are taking 12+ hours of courses and have a GPA that's under 2.0 for the selected semester. It can be filtered by Campus, Division, Department, Program, and Level. It returns results from one School Year and Semester at a time. A checkbox controls whether the report displays the students' Social Security number or leaves it off for security purposes. Available as a PDF or an Excel file.
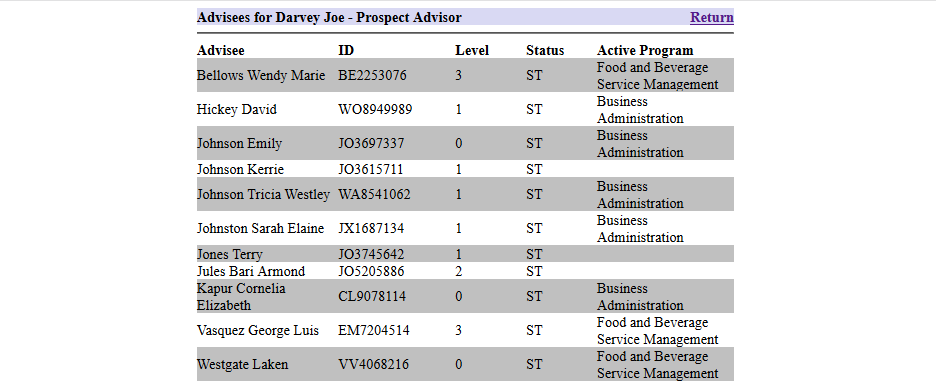
Advisors Listing
The Advisors Listing report details how many students are assigned to each faculty Advisor. The results can be filtered by Campus, Division, Department, and/or Module Status as well as by Advisor Type. Administrators can select a single advisor or leave no advisor selected to view every faculty member listed as an advisor. The report displays as a printable web report page.
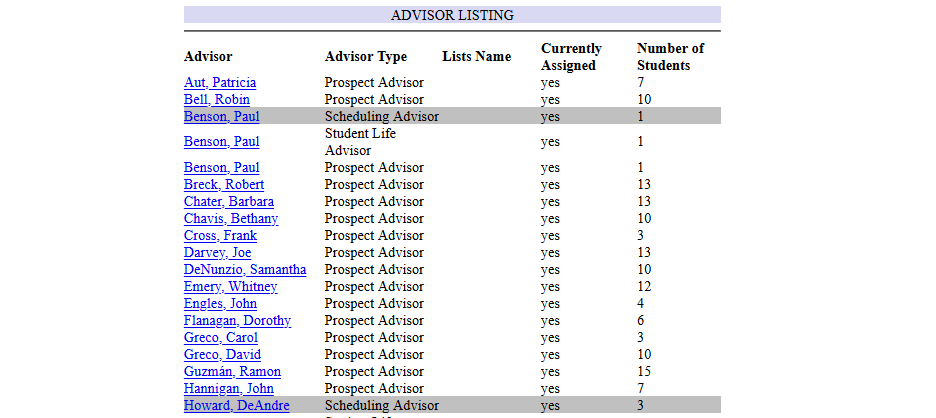
Each advisor's name is displayed a clickable link that leads to a list of their assigned students.
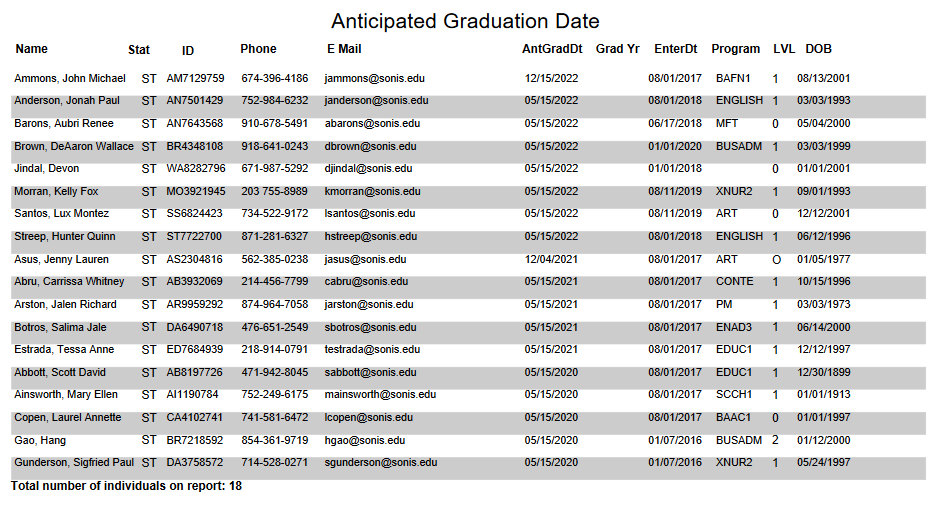
Anticipated Graduation Date
The Anticipated Graduation Date report displays a list of users by their anticipated graduation date. The results can be filtered by Campus, Division, Department, Module Status, Program, and/or Level as well as by the Anticipated Graduation Date. A checkbox controls whether the report displays the user's Social Security number or leaves it off for security purposes. Available as a PDF or an Excel file.
At-Risk/Enrollment Interest Report
The At-Risk/Enrollment Interest Report is to provide data on the At-Risk status of Jenzabar SONIS users. For more about the At-Risk/Enrollment Interest system, visit the At-Risk Alerts documentation. The report can be narrowed down by Campus, Division, Department, and Level. The Student Module Status is selected by default, but other statuses can be selected.
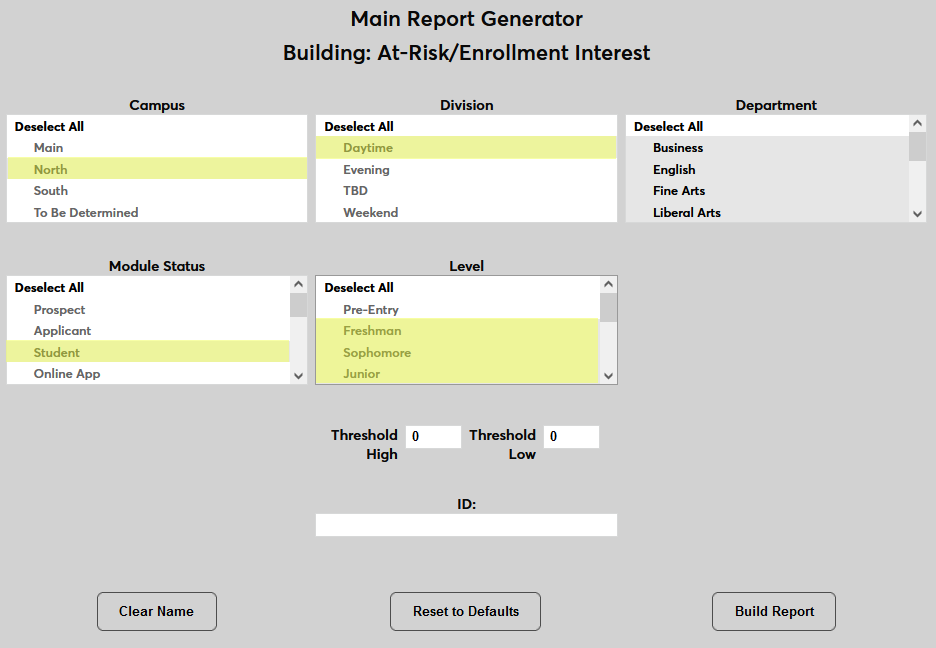
Use the Threshold High field to set the bottom of the threshold. Only numbers greater than or equal to than this threshold will be displayed.
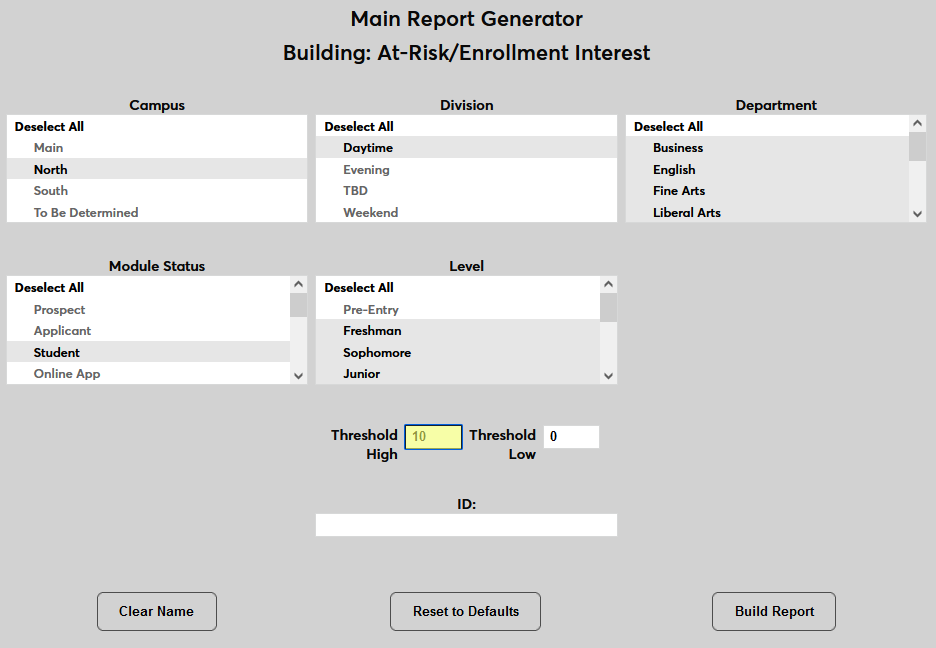
Use the Threshold Low field to set the top of the threshold. Only numbers less than or equal to than this threshold will be displayed.
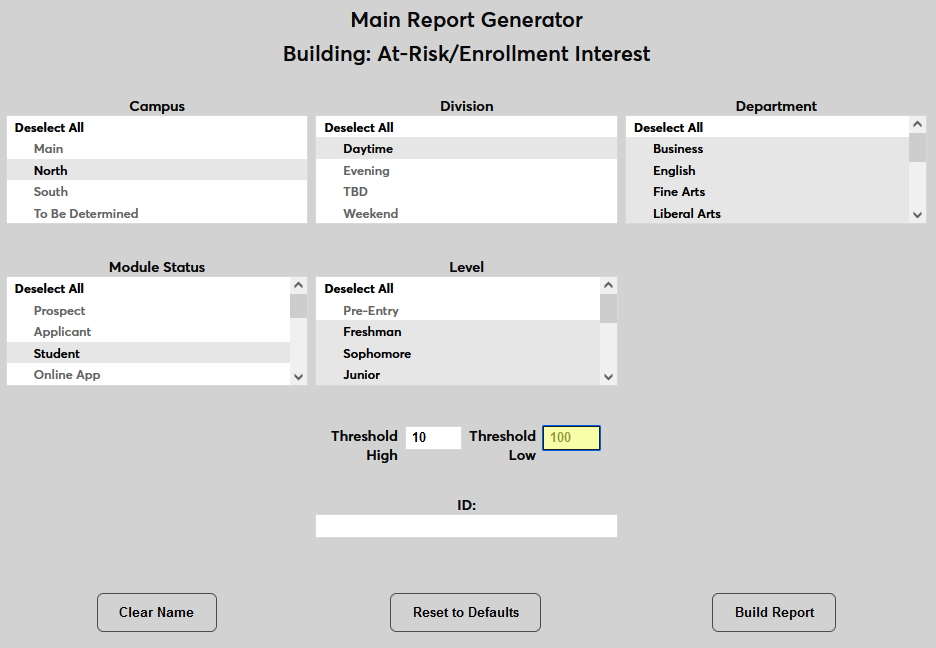
An optional ID field is available to view an individual user's score.
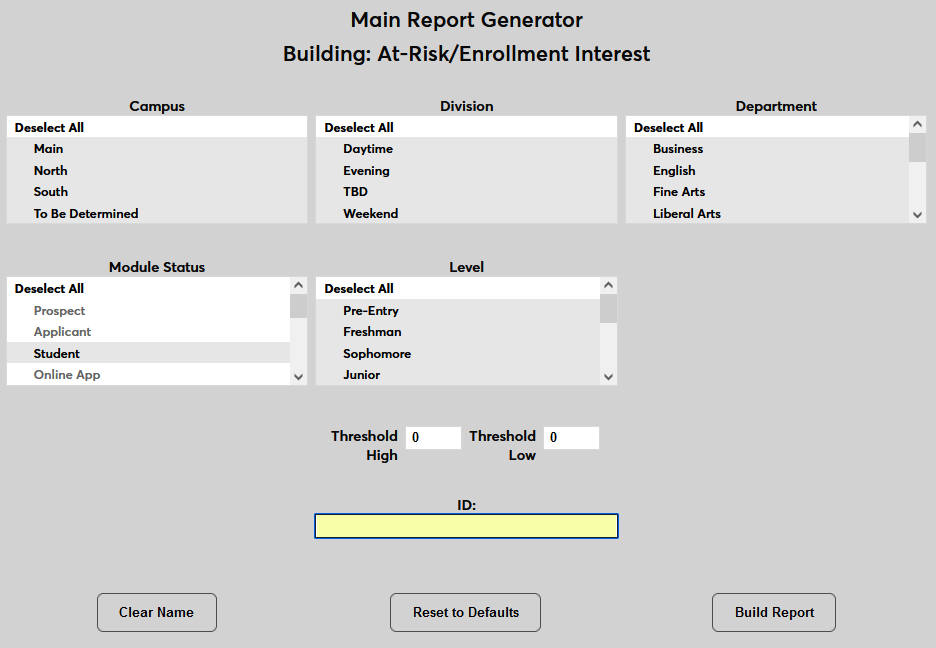
Once the correct sorting data is in place, click the Build Report button.
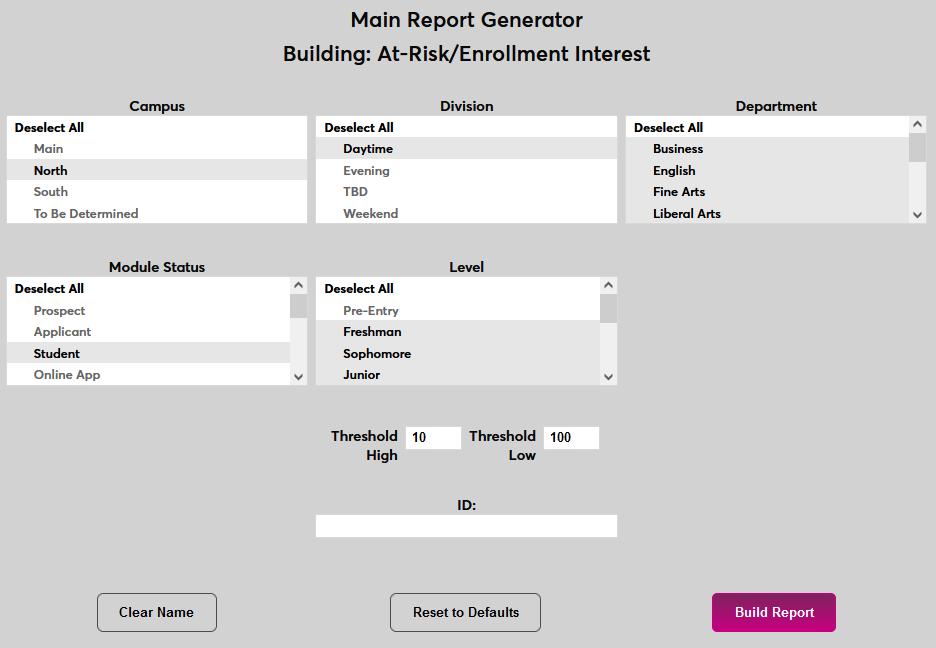
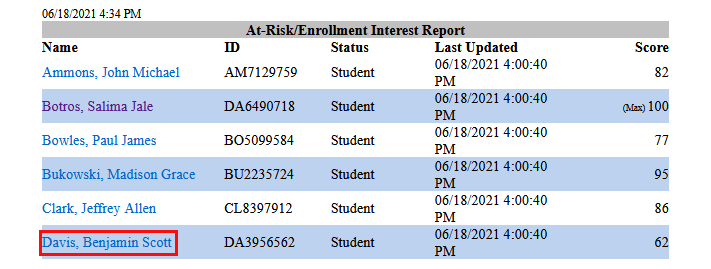
On the next page, click the Preview Report button. The report will open in a new window.

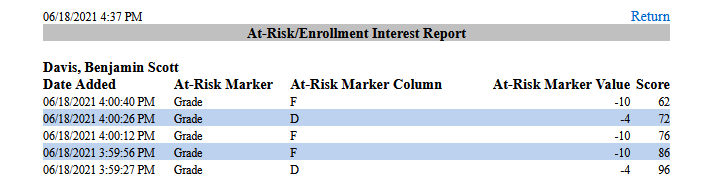
The report displays the user's Name , ID , Status , and Score along with the date and time that their score was Last Updated . Click on a name to drill down and see the various factors that make up the score.
Audit
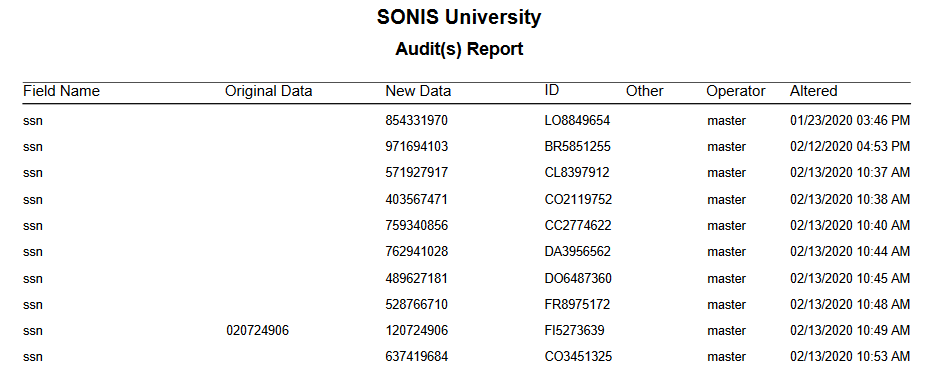
The Audit Report allows administrators to view any changes that have been made to a few key user Record fields such as first and last name, social security number, phone number, etc. The report can be filtered based on the specific Field or by the Operator along with the Date Range when the change was made. All users with an administrator login are included in the Operator list. PDF only.
Award Detail/En Credits
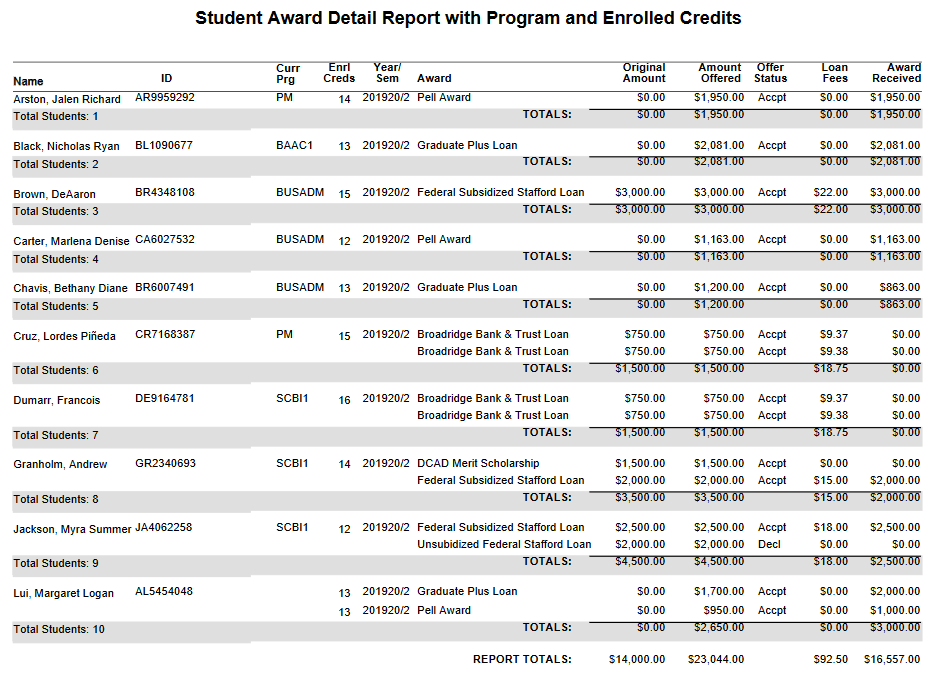
The Award Detail/Enrl Credits report displays the details of financial aid that has been awarded along with the student or students' current enrollment. The results can be filtered by Campus, Division, Department, Module Status, Program, Level, School Year, and/or Semester as well as by the Award. Administrators can choose to view Accepted Only, Declined Only, No Response Only, or All awards. A checkbox controls whether the report displays the user's Social Security number or leaves it off for security purposes. Another checkbox offers the option to Include disabled awards. With this box checked, all award in the system will appear in the Award Codes dropdown menu regardless of their status. Available as a PDF or an Excel file.
Birthdays
Birthday List
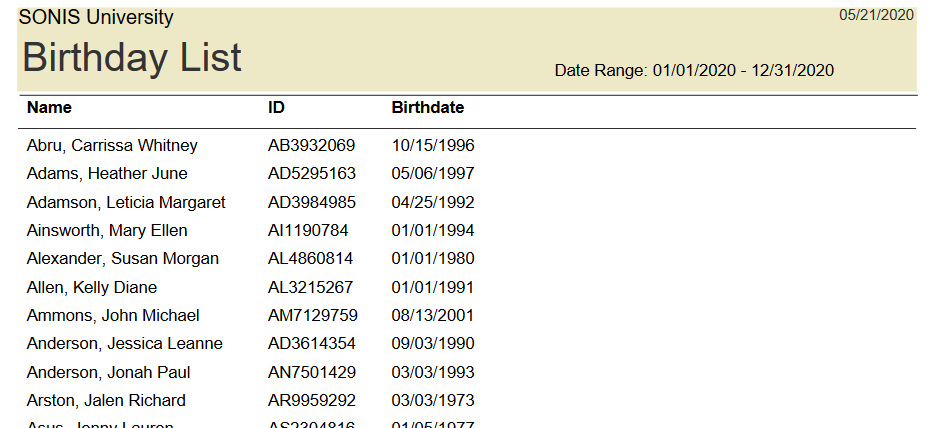
The Birthday Lists report displays a list of user birthdays. The results can be filtered by Campus, Division, Department, and/or Module Status as well as by Birthdate range. An additional field allows administrators to Exclude Dates On or Before a chosen date. An Exclude Year checkbox is available as well to give users included in the report more privacy and prevent potential age discrimination. Available as a PDF or an Excel file.
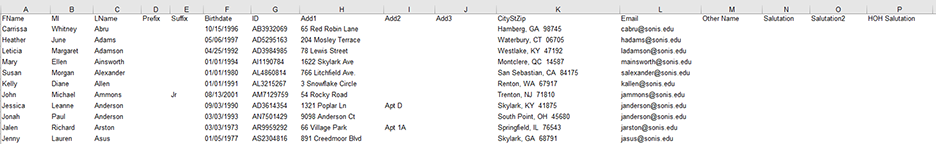
Birthday Mail Merge
The Birthday Lists report displays a list of user birthdays along with their mailing information. The results can be filtered by Campus, Division, Department, and/or Module Status as well as by Birthdate range. An additional field allows administrators to Exclude Dates On or Before a chosen date. An Exclude Year checkbox is available as well to give users included in the report more privacy and prevent potential age discrimination. Excel file only.
Miscellaneous "B" Reports
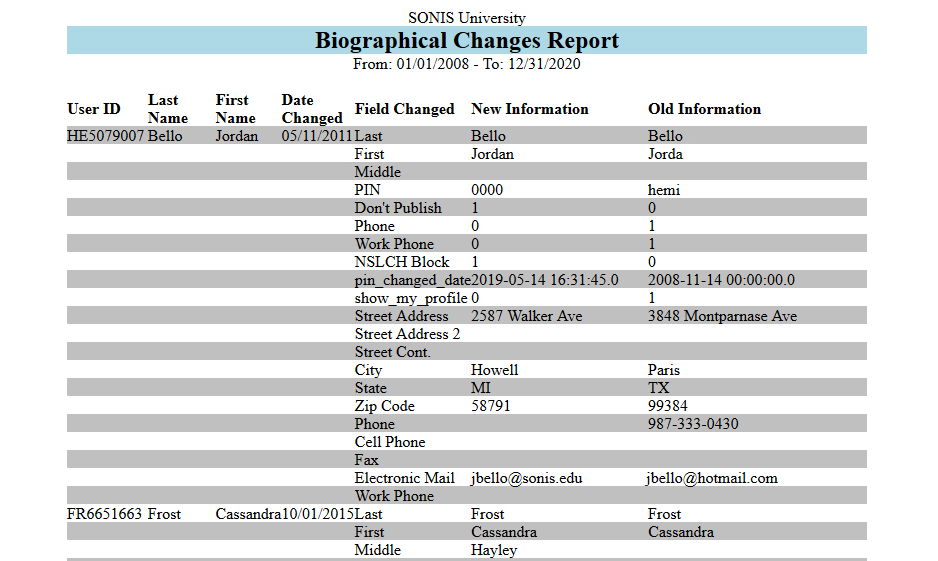
Biographical Changes Report
The Biographical Changes Report catalogs changes that have been made to user biographic pages. The report can be filtered by Module Status as well as by the date range when the changes were made. Displays as a printable web report.
Business and Industry Course Log
Business: Payment Plans
The Payment Plans Report displays information about student Payment Plans. The report can be filtered by Campus, Division, Department, and Semester as well as by the Payment Plan type. The report displays one School Year at a time. An ID field is included to select a single student and an As of Date field is included to change the dates that are displayed. Displays as a printable web report. Click on the payment plan type to view individual student details.
Charges/Credits
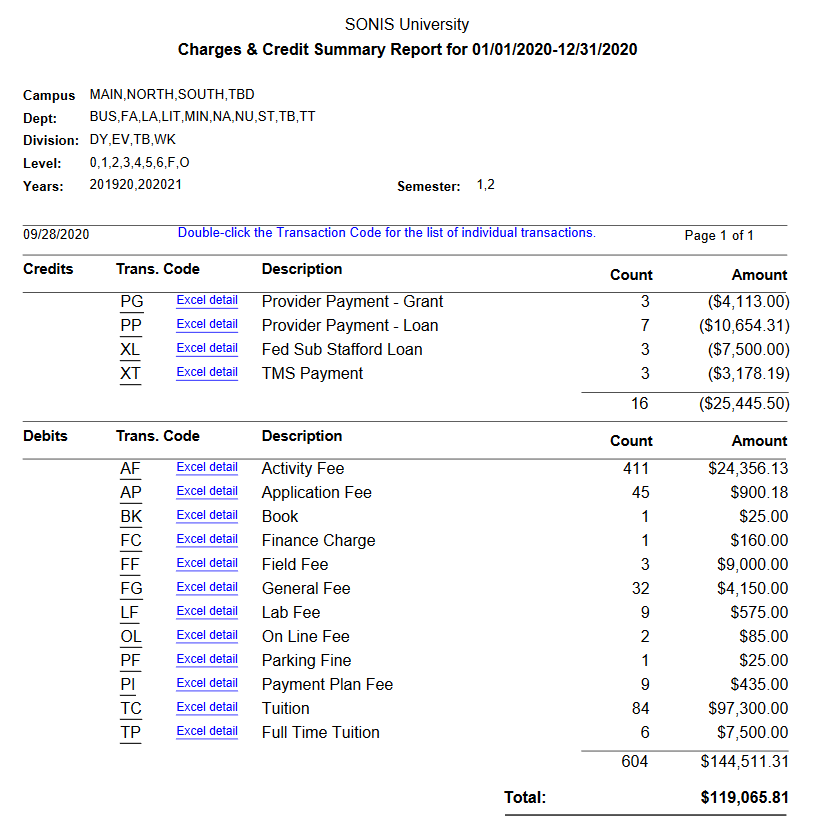
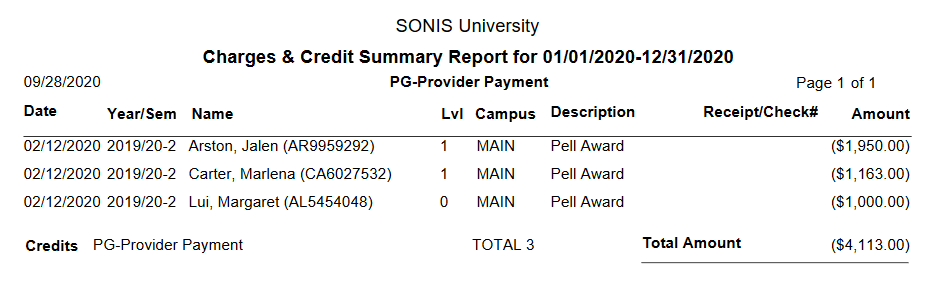
Charges/Credits Report
The Charges/Credits report displays the total charges and credits that the institution has processed sorted by Transaction Code. The results can be filtered by Campus, Division, Department, Level, School Year, and/or Semester as well as by a Transaction Date range. The report is available as a PDF or an Excel file. If the PDF version is selected, administrators can view a list of individual transactions by clicking the transaction code or download those transactions an Excel report by clicking the Excel detail link.
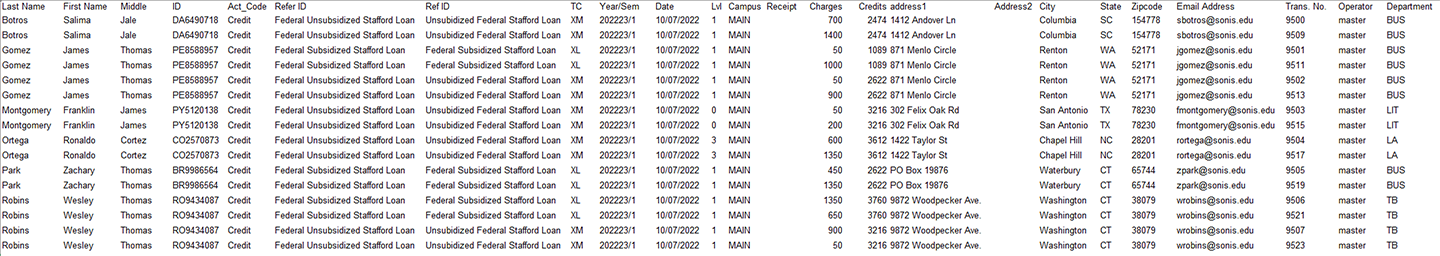
Charges and Credits Details in Excel
The Charges and Credits Details in Excel report displays the same information as the Excel detail link in the Charges/Credits Report, but allows additional options for building. The results can be filtered by Campus, Division, Department, Level, School Year, and/or Semester as well as by a Transaction Date range. Unlike the Charges/Credits report, only one school year and semester and be selected at a time. However, multiple Transaction Codes can be selected. The report can display Charges, Credits, or Both.
Courses
Course Listing
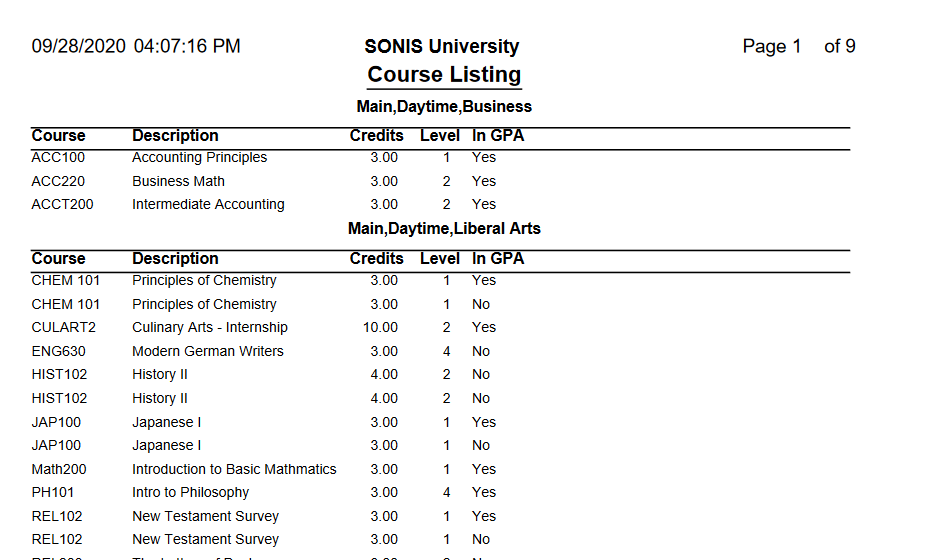
The Course Listing report displays a list of all courses that the institution offers. The results can be filtered by Campus, Division, and/or Department. Select the Active Only? button to display only active courses. Select the All Courses? button to display all courses or the Non-Transfer Courses Only to display only local courses. Available as a PDF or an Excel file.
Course Section Deleted
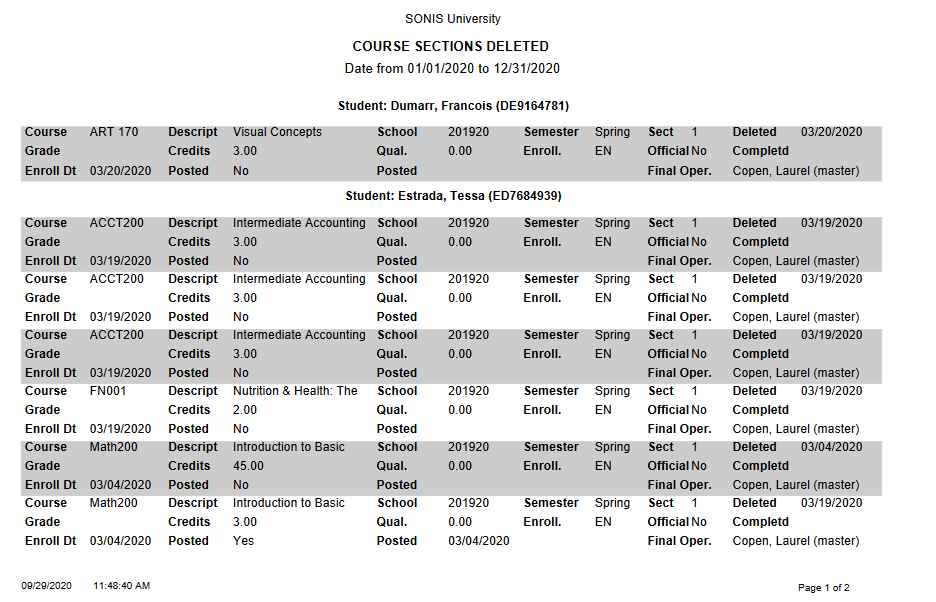
The Course Section Deleted report displays courses that have been removed from user records. The results can be filtered by one or more school years and semesters, the operator, and a date range. Administrators can choose to view one specific course or select All Courses. Available as a PDF or Excel file.
Course Section ID
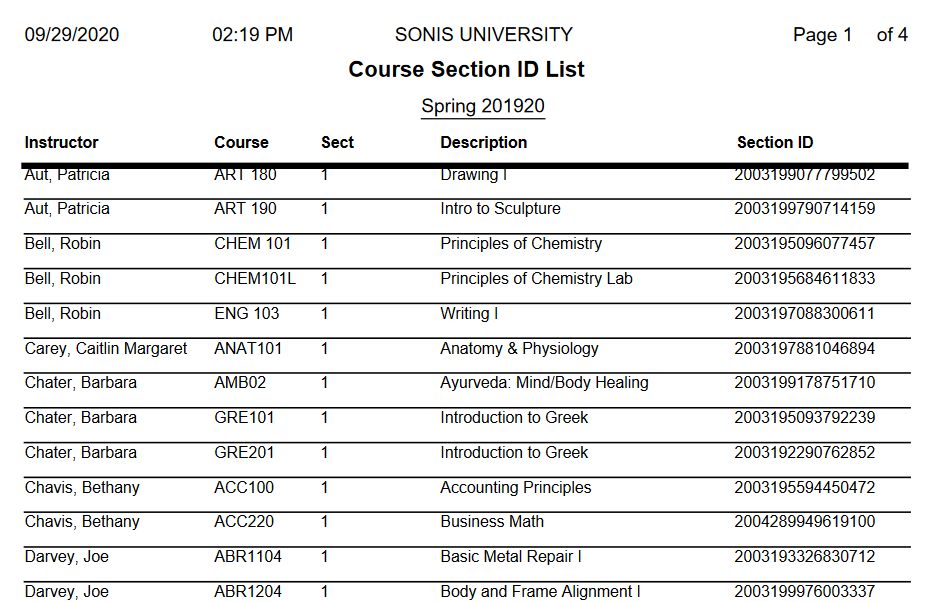
The Course Section ID report displays course sections being offered in the chosen school year(s) and semester(s) sorted by section ID. The results can be filtered by Campus, Division, and/or Department. Available as a PDF or an Excel file. Section IDs are unique values and are not repeated within a year. Institutions utilizing the Score Import functions can use this report, or the Exam ID Utility to assist in setting up ParScore or LXR*Test.
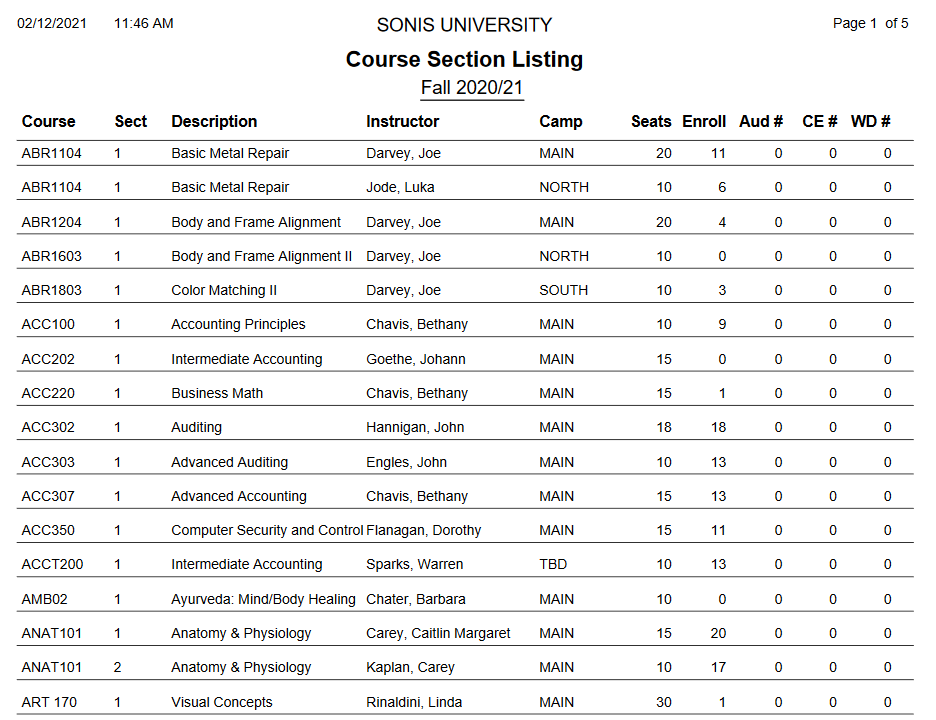
Course Section Listing
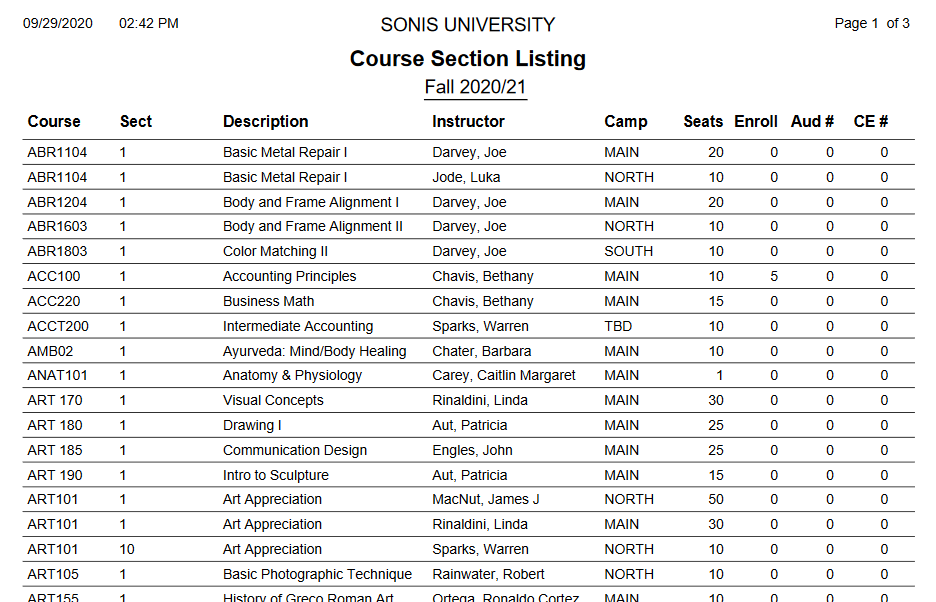
The Course Section ID report displays course sections being offered in the chosen school year(s) and semester(s) sorted by course ID. The results can be filtered by Campus, Division, and/or Department as well as the Delivery Method. Available as a PDF or an Excel file.
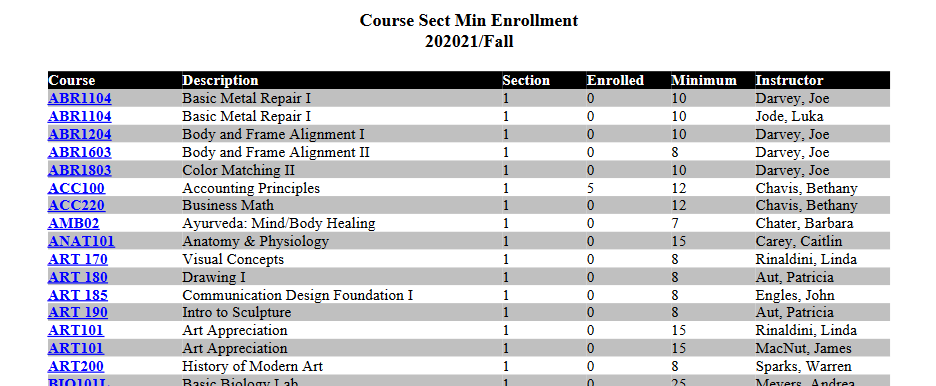
Course Section Minimum Enrollment
The Course Section Minimum Enrollment report displays course sections being offered in the chosen school year(s) and semester(s) listed by their minimum enrollment. The results can be filtered by Campus, Division, and/or Department as well as the Delivery Method. Available as a PDF or an Excel file.
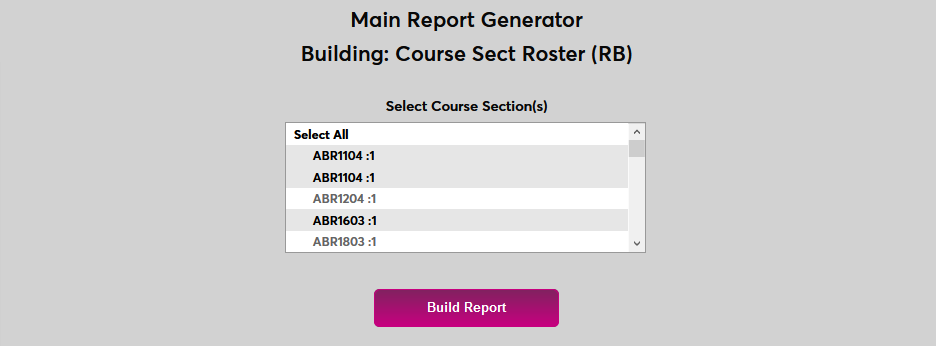
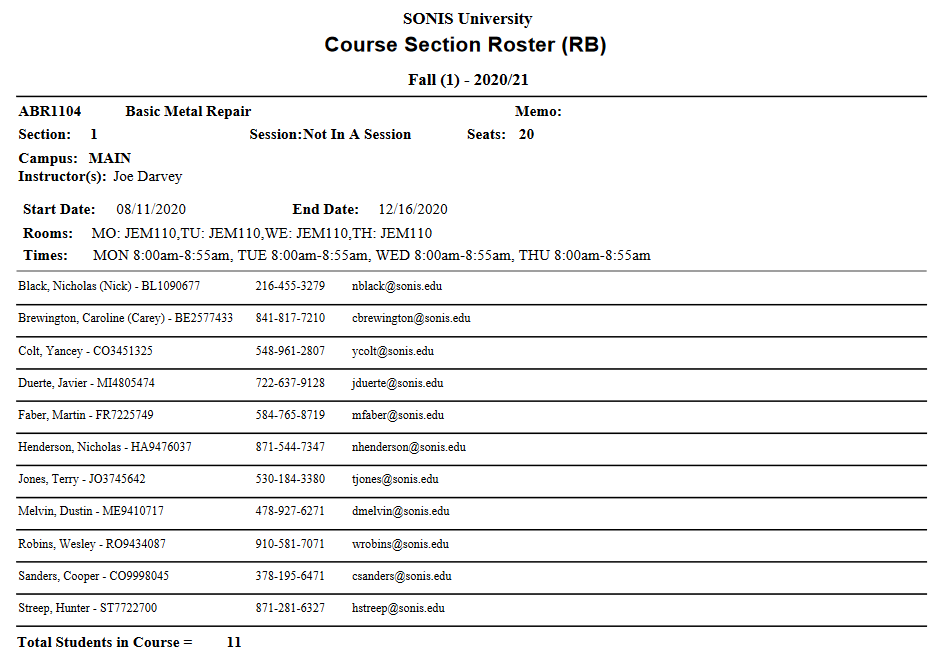
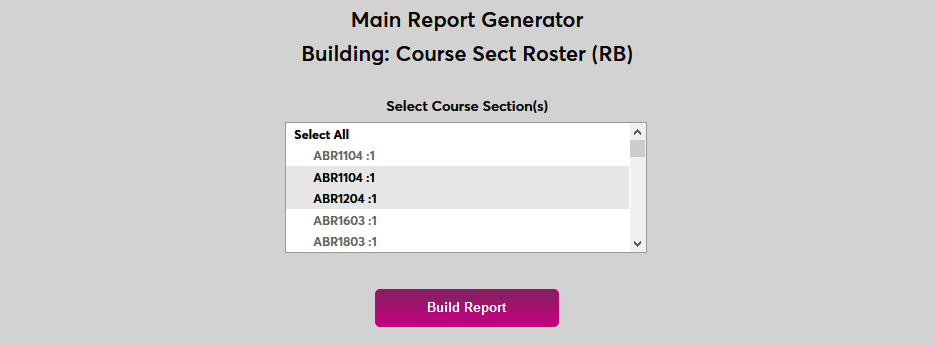
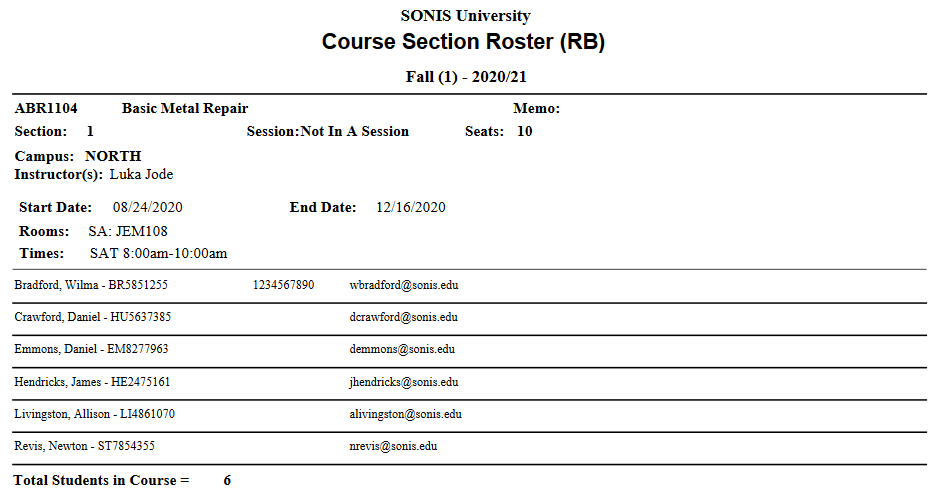
Course Section Roster
The Course Section Roster report displays the individual roster of each active course section in a chosen semester. The results can be filtered by Campus, Division, and/or Department as well as the Delivery Method and Contract Number. The report is available as a PDF or an Excel file. Check the Select Course Section(s) box to select individual sections to show in the report or leave the box unchecked to display them all. Each course section will be on its own page of the PDF report regardless of this choice.
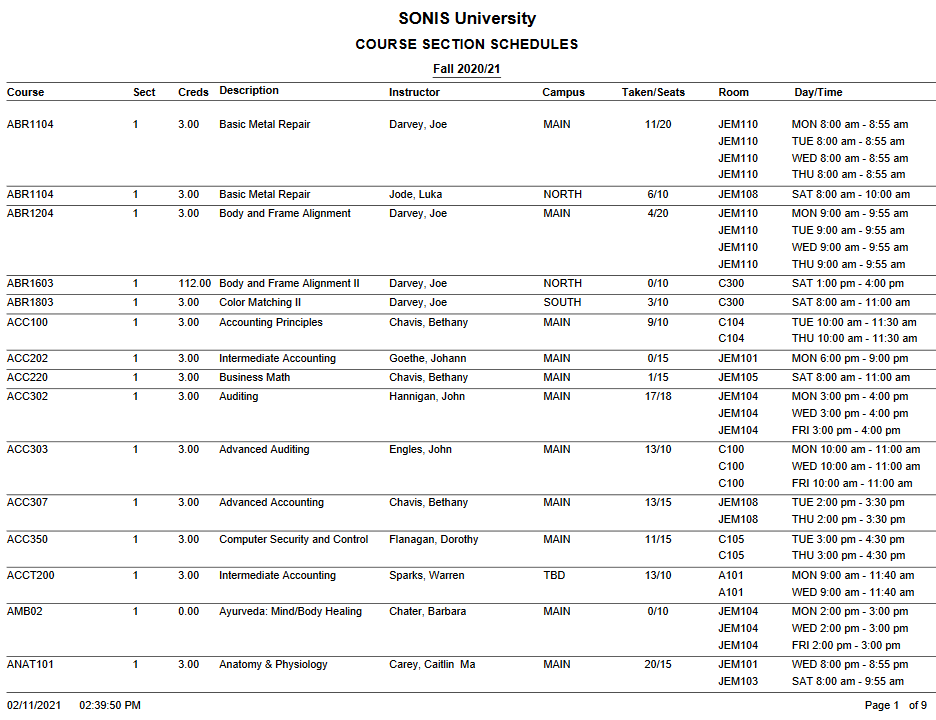
Course Section Schedules
The Course Section Schedule report displays displays the individual roster of each active course section in a chosen semester. The results can be filtered by Campus, Division, and/or Department as well as the School Year, Semester, and Session. Available as a PDF or an Excel file.
Course Section Listing with Withdrawals
The Course Section Listing with WD report displays the the number of students attached to any course, whether enrolled as a traditional student, auditing the course, enrolled as a CE student, or withdrawn. The results can be filtered by Campus, Division, and/or Department as well as the School Year and Semester, and the Delivery Method. Available as a PDF or an Excel file.
Course Section Roster of Enrolled Student Details
The Course Section Roster of Enrolled Students Details report displays the the number of students attached to any course, whether enrolled as a traditional student, auditing the course, enrolled as a CE student, or withdrawn. The results can be filtered by Campus, Division, and/or Department as well as the School Year and Semester, and the Delivery Method. Available as a PDF or an Excel file. Check the Select Course Section(s) box to select individual sections to show in the report or leave the box unchecked to display them all. Each course section will be on its own page of the PDF report regardless of this choice.
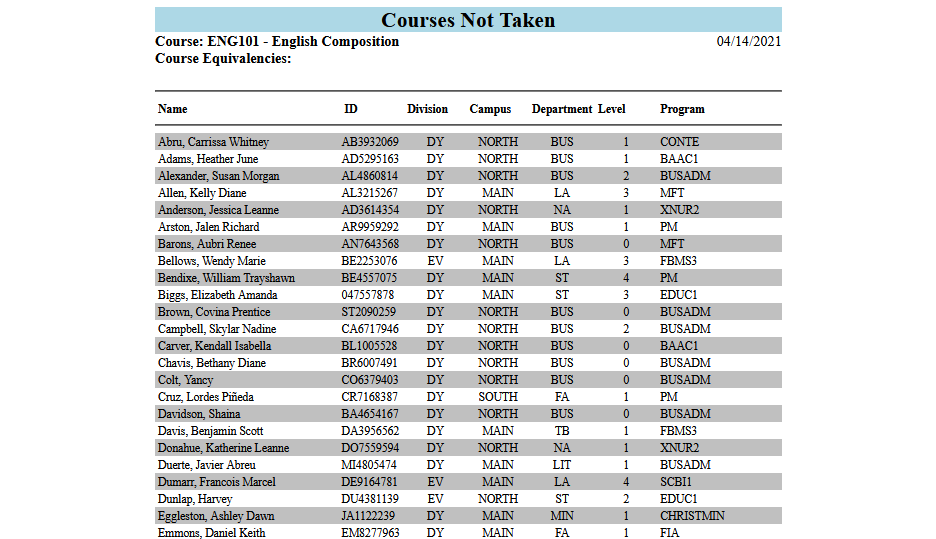
Courses Not Taken
The Courses Not Taken report displays a list of users who have not taken a selected course. The results can be filtered by Campus, Division, Department, Program, and/or Level. The report displays the course, the course description, and any equivalencies that the course may have. Only one course can be selected at a time. If no course is selected, the report will display the first course in the system alphabetically by description.
CRA
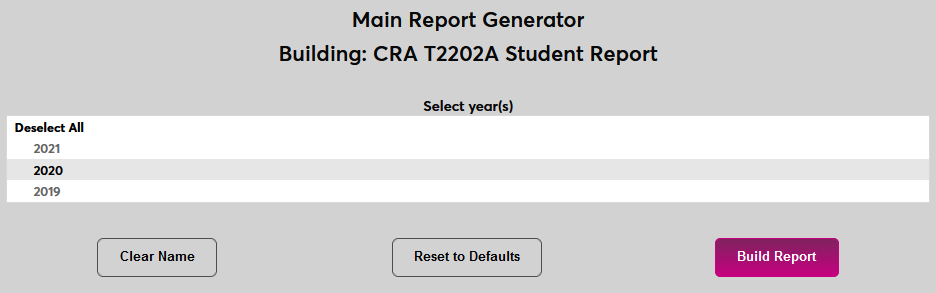
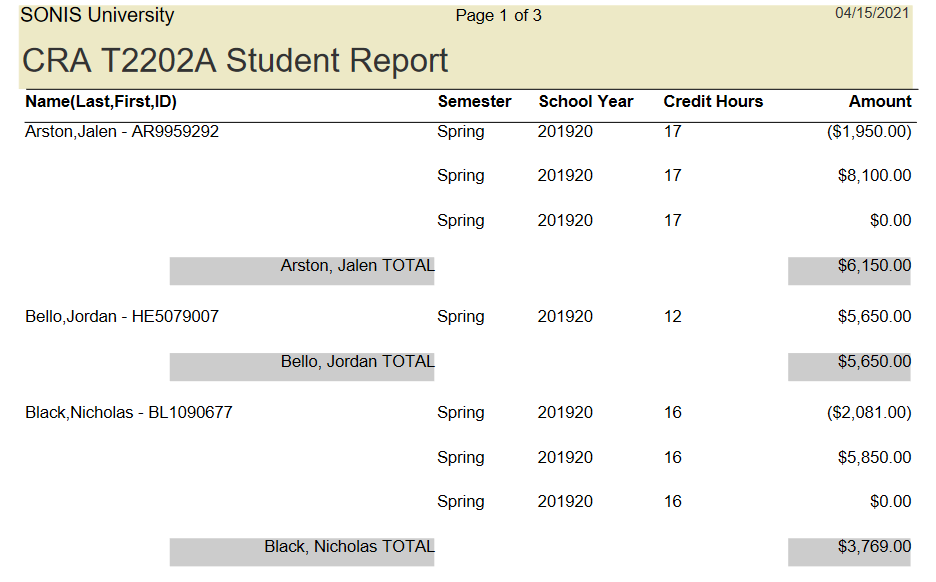
CRA T2202A Transactions Report
The CRA T2202A student report displays qualifying charges based on Canadian Revenue guidelines sorted by student. The user must select a year to build the report. For more on the T2202A process, visit the documentation page.
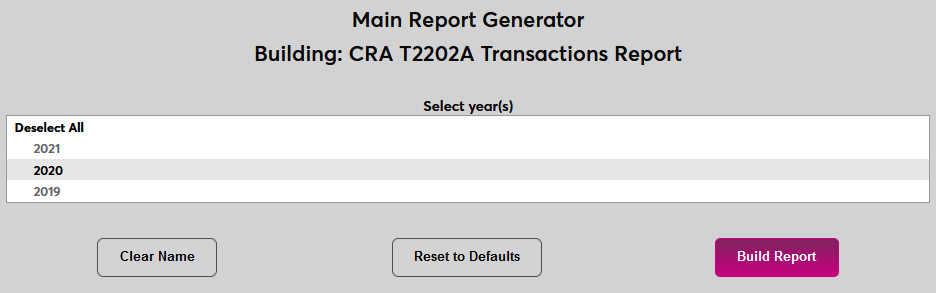
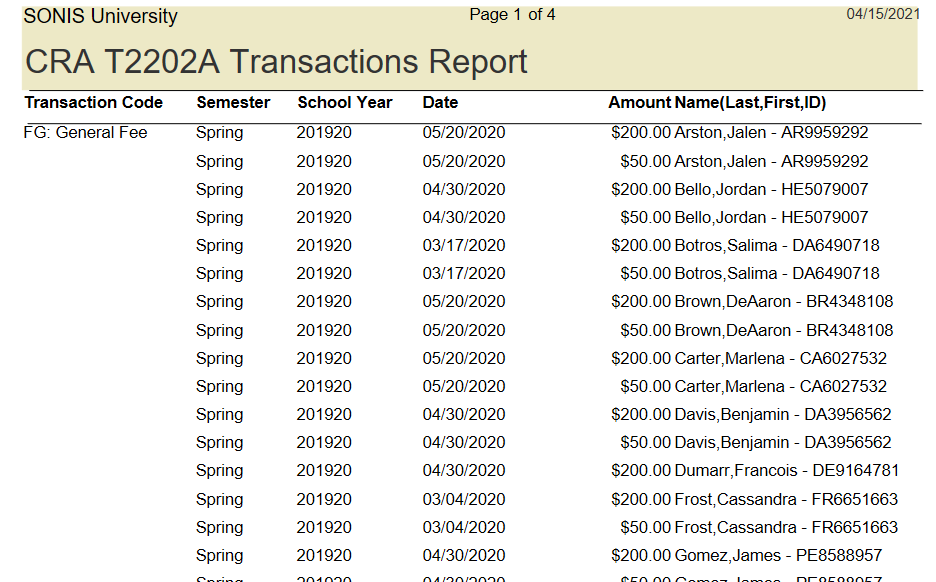
CRA T2202A Transactions Report
The CRA T2202A student report displays qualifying charges based on Canadian Revenue guidelines sorted by transaction code. The user must select a year to build the report. For more on the T2202A process, visit the documentation page.
Miscellaneous "C" Reports
Career Services Placement
The Career Services Placement report provides a listing of meetings that students have had with the institution's career services team. The results can be filtered by Campus, Division, Department, and Program as well as by the Begin Date and End Date. Users can select one or more Career Service Advisors to include or leave them all selected to view all placements.
CE Registration Summary
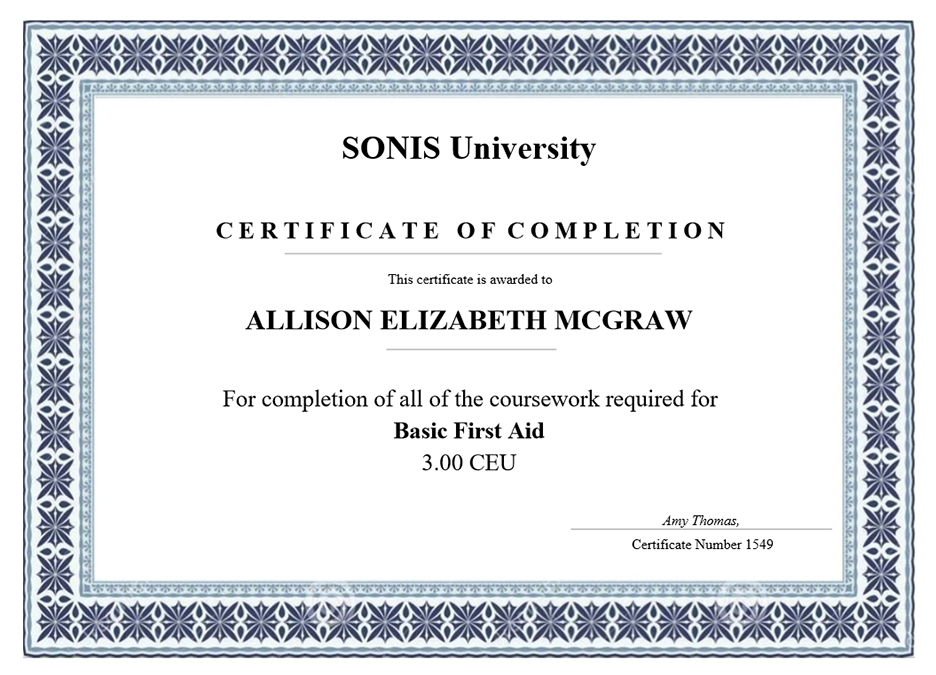
Certificate of Completion
Jenzabar SONIS offers the ability for schools to grant a certificate to their Continuing Education (CE) students after they've completed a specified course. Once the student has passed one or more of these courses, they will have access to print their earned certificate(s) through their Student Portal. The certificate report can be filtered by Campus, Division Department and Begin and End dates. A single School Year and Semester must be selected as well. For more about the setup process, click here.
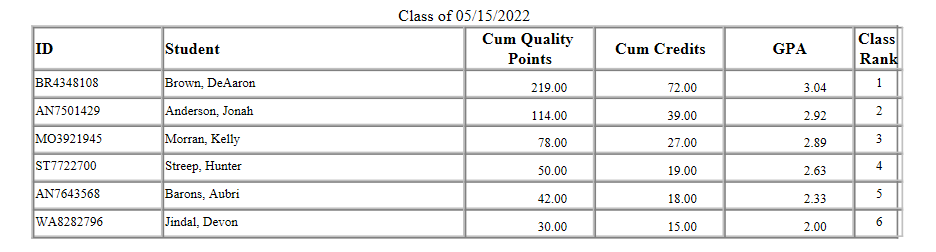
Class Rank
The Class Rank report displays students by in order of their class rank based on their GPA. The results can be filtered by Campus, Division, Department, Program, and Level as well as by the School Year and Semester. Users must select at least one Anticipated Graduation Date as this date is used to determine the class. If more than one date is selected, each class will be listed on a separate page.
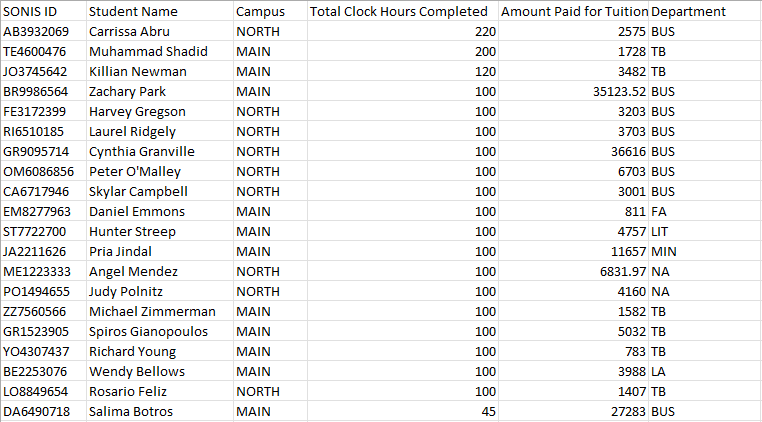
Clock Hours and Revenue Comparison
The Clock Hours and Revenue Comparison report allows users to view a comparison of student tuition paid to student clock hours completed. The results can be filtered by Campus, Module Status, and Transaction Code as well as by the Transaction Date range. The columns that display in the report are: SONIS ID, Student Name, Campus, Total Clock Hours Completed, Amount Paid for Tuition, and Department. The report opens as an Excel file.
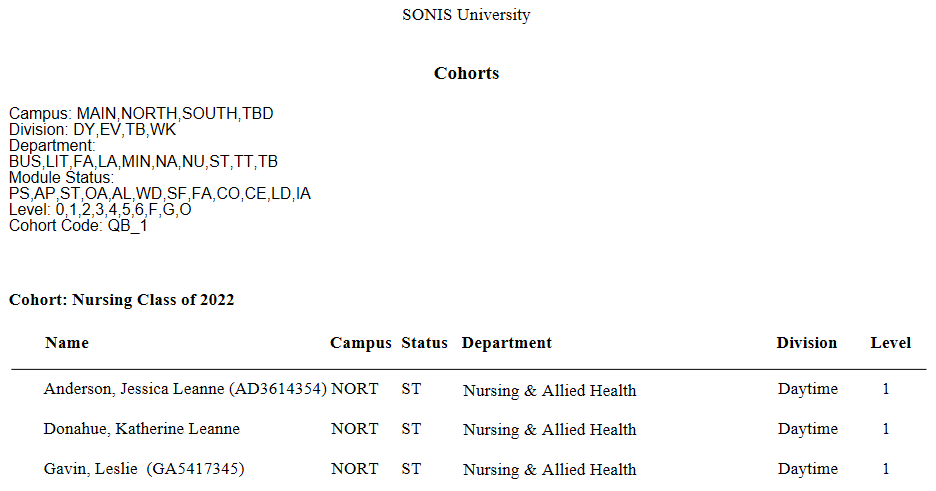
Cohort
The Cohort report lists users by their cohort. The results can be filtered by Campus, Division, Department, Cohort, Program, and Level. The report lists the included cohorts at the top and then each cohort.
Corporate Billing
The Corporate Billing report is used to create a bill that can be sent to employers for courses, course materials, and any other expenses that they may be covering on behalf of students. The report can be filtered by Campus and Employer as well as by the Transaction Date range. The Employer list is populated based on the employers created using the Employer utility under the Systems menu.
Development
DE Alumni Donor Information
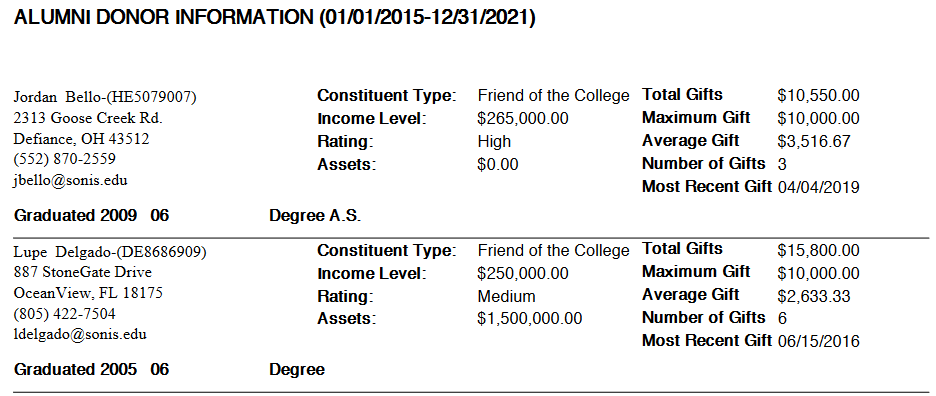
The DE Alumni Donor Information report lists vital information about donors who attended the college that can be used to target future development outreach. It includes basic donor information plus the user's graduation month/year and their degree. The report is based on the information entered in each user's Constituent Information record. The results can be filtered by Event, Fund, Constituent Type, Graduation Month/Year, State, and Pledge Date range. A single individual can also be selected using the ID field. PDF or Excel.
DE Constituent Related Accounts
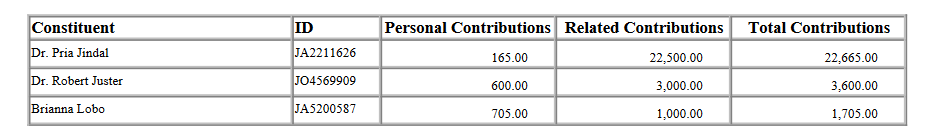
The DE Constituent Related Accounts report is designed to show a constituent's total contributions, including contributions they may have made through an organization that is also listed in the SONIS system as a constituent. This could be a business, a non-profit, or another kind of organization. For the report to display data, a relationship called "holder" must exist and the constituent must having a Relationships record designating them as the holder of the account. The organization should have a corresponding Relationships record designating them as held by the constituent.
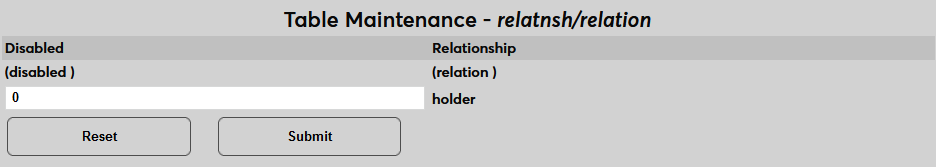

Additionally, both the individual and the organization must have development payment transactions. The report can be filtered by the Event, Fund, Relation, and Pledge Date range. A single constituent can also be selected using the ID field.
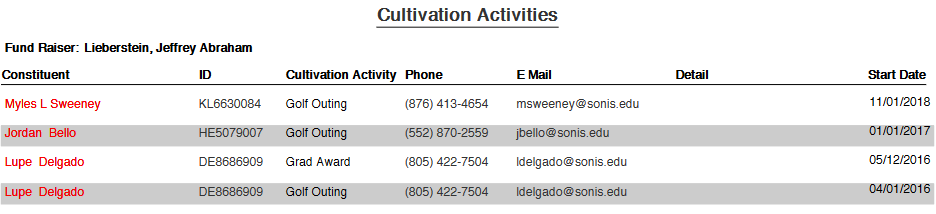
DE Cultivation Activities
The DE Cultivation Activities is a report provides information on contacts that have been made with donors. The report is based on the information entered in each user's Cultivation Activities record. The results can be filtered by Constituent Type, Cultivation Activity, Staff Fundraiser, and Cultivation Activity Date range. A single individual can also be selected using the ID field. PDF or Excel.
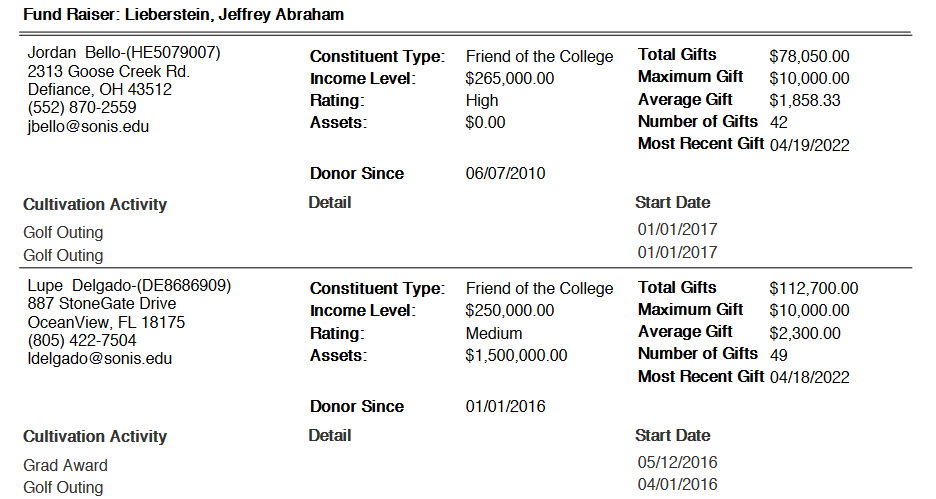
DE Donor Cultivation Activities
The DE Donor Cultivation Activities report provides vital information about past donors and lists activities that they've participated in. The report is based on the information entered in each user's Constituent Information and Cultivation Activities records. The results can be filtered by Constituent Type, Cultivation Activity, Staff Fundraiser, and Cultivation Activity Date range. A single individual can also be selected using the ID field. PDF or Excel.
DE Donor Information
The DE Alumni Donor Information report lists vital information about past donors that can be used to target future development outreach. The report is based on the information entered in each user's Constituent Information record. The results can be filtered by Event, Fund, Constituent Type, and State. A single individual can also be selected using the ID field. PDF or Excel.
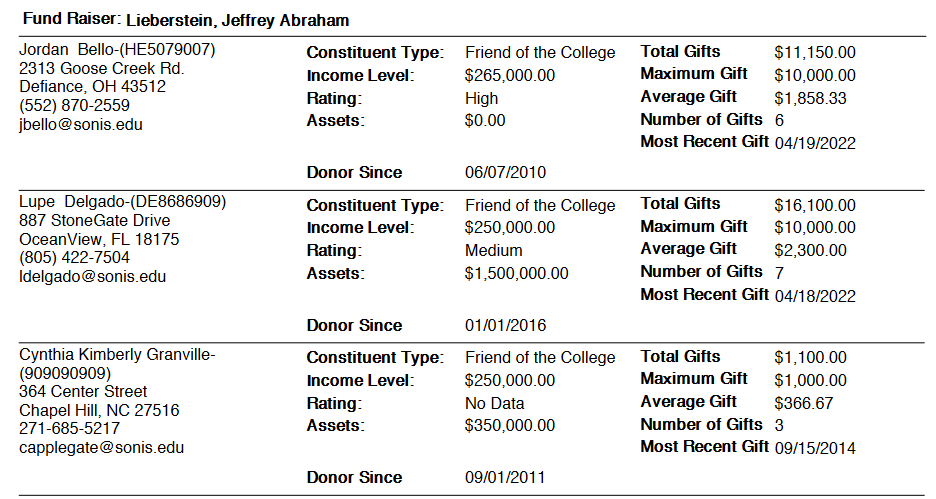
DE Donors by Maximum Gift
The DE Alumni Donor Information report lists vital information about past donors that can be used to target future development outreach. The report is based on the information entered in each user's Constituent Information record and is identical to the DE Donor Cultivation Activities report other than the fact that it's sorted by the monetary amount of the donor's maximum gift. The results can be filtered by Event, Fund, Constituent Type, State, and the Pledge Date range. PDF or Excel.
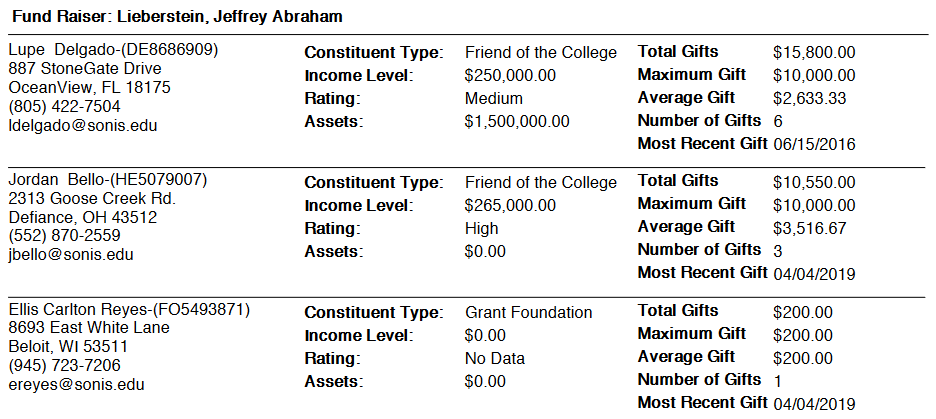
DE Donors by Total Gifts
The DE Alumni Donor Information report lists vital information about past donors that can be used to target future development outreach. The report is based on the information entered in each user's Constituent Information record. The results can be filtered by Event, Fund, Constituent Type, State, Staff Fundraiser, and the Pledge Date range. PDF or Excel.
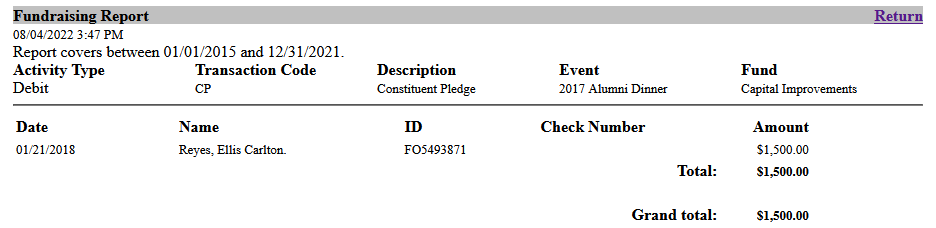
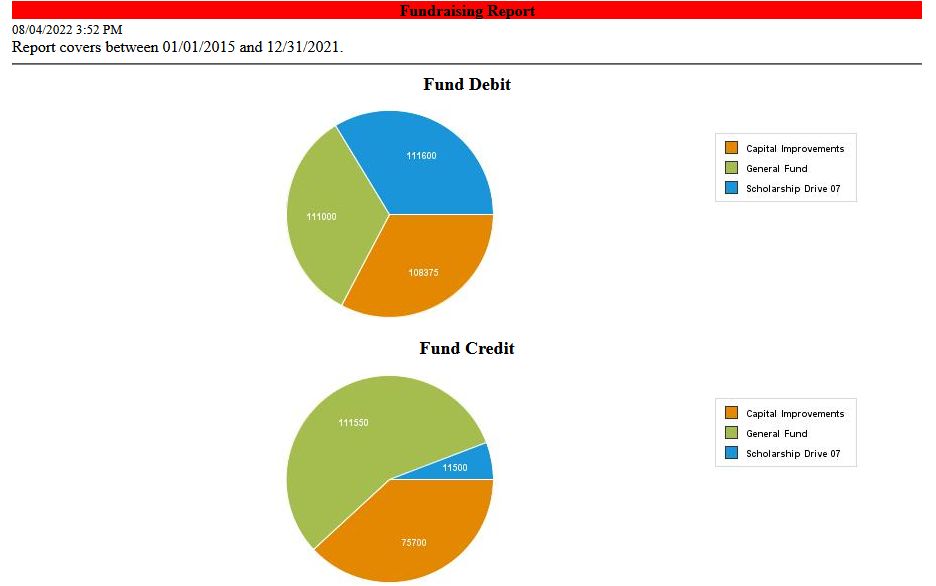
DE Fundraising Details
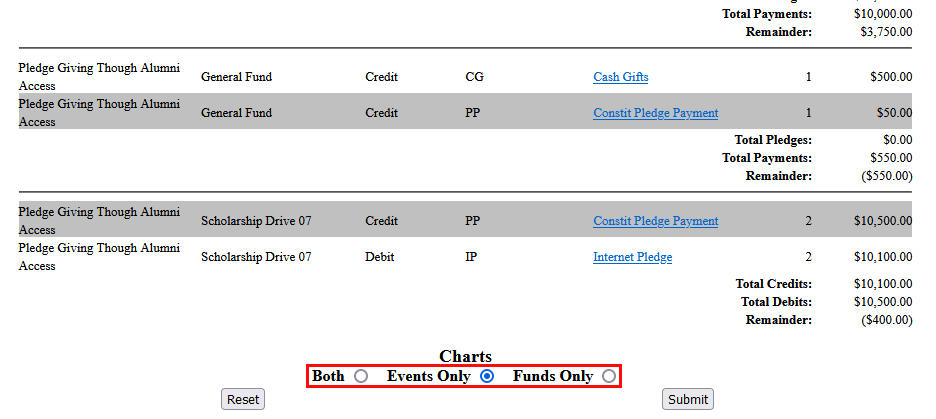
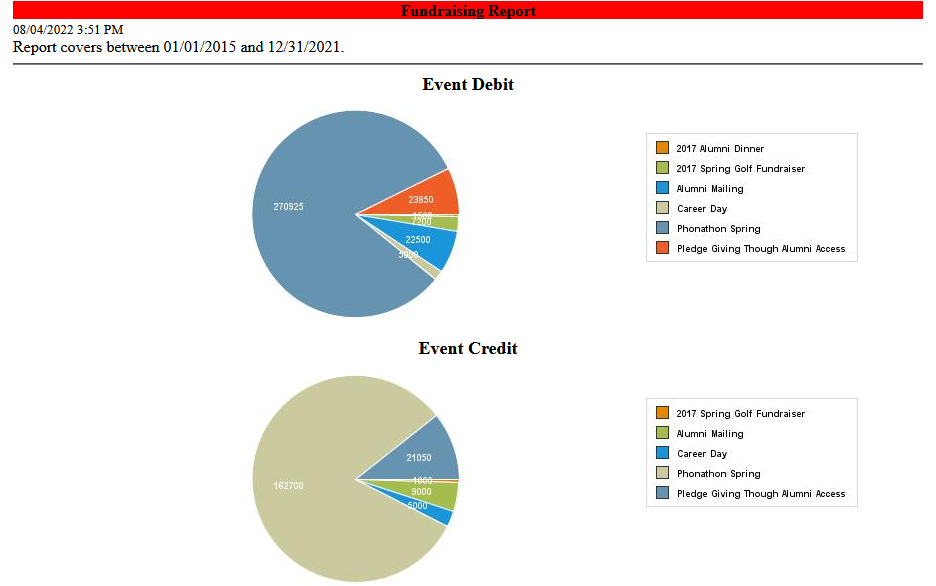
The DE Fundraising Detail report lists fundraising transactions. The results can be filtered by Campus, Division, Department, Department, Level, Code, Event, Fund, and the Pledge Date range. CFM only. Click on the Description of a transaction to view additional details.
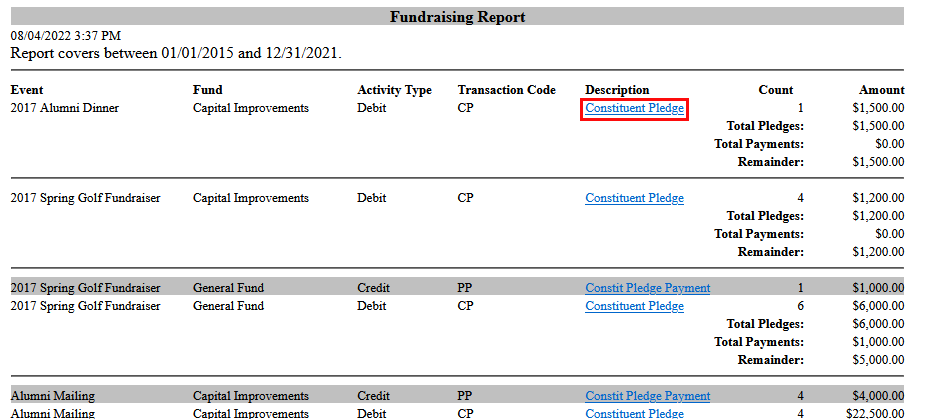
The report can also be filtered to show pie chart summaries of event or fund details.
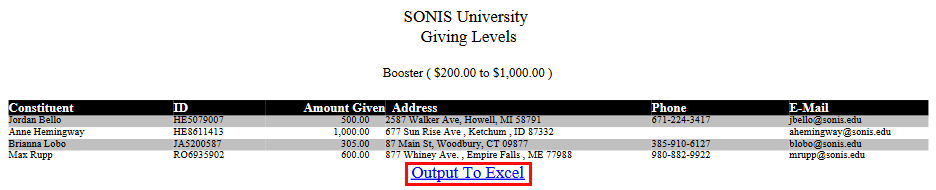
DE Giving Levels
The DE Giving Levels report lists donors by their giving level. Giving levels are created using the Giving Levels utility under the Systems menu. Once they've been created, donors are automatically assigned a giving level based on their lifetime giving total. The report can be filtered by the Constituent Type and the Giving Level. Click Output to Excel to download a spreadsheet of the data.
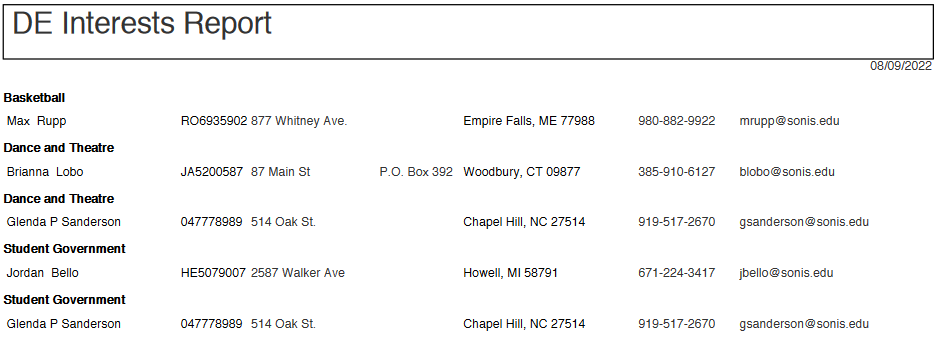
DE Interests
The DE Interests report lists donors based on interests they have and activities they once participated in. This information comes from each constituent's Interests record. The report can be filtered by Interest/Activity, Constituent Type, and the Interest Date range. A single donor can be selected by entering a SONIS ID in the ID field. Note that the interest begin and end dates must fall within the Interest Date range if these fields are used.
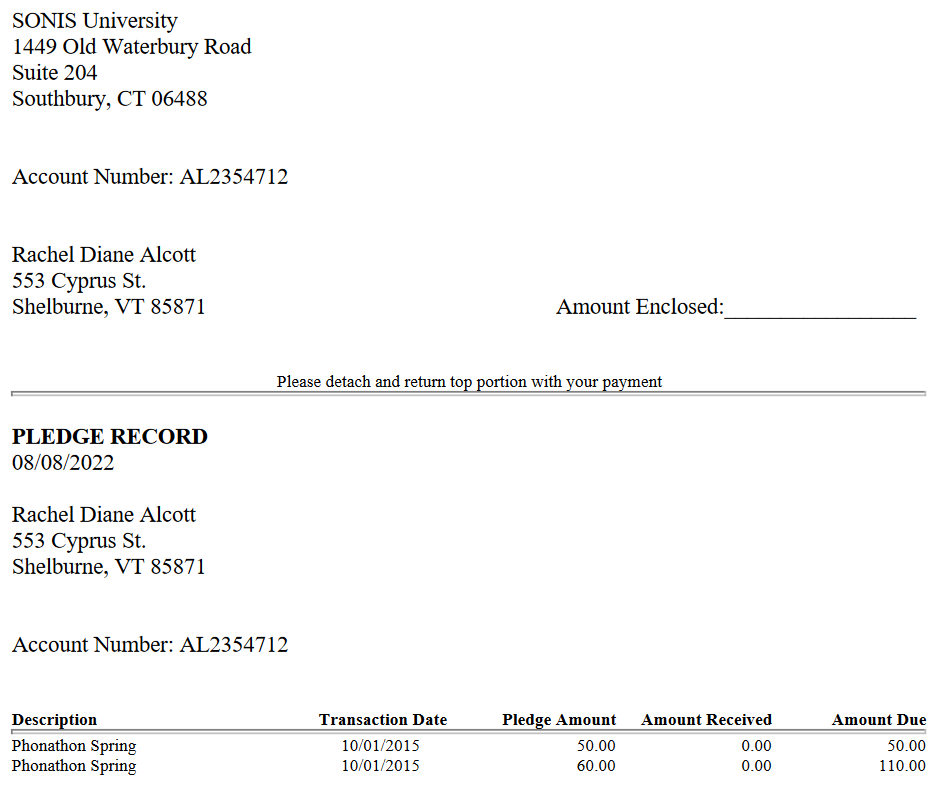
DE Pending Pledges
The DE Pending Pledges report lists all donation pledges that have not yet been fulfilled. The report can be filtered by Campus, Division, Department, Event, and Fund and by an As of Date. A single individual can also be selected using the ID field. The report lists each donor separately and can be sent to the person who made the pledge as a bill or reminder.
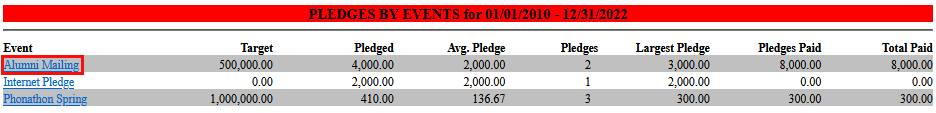
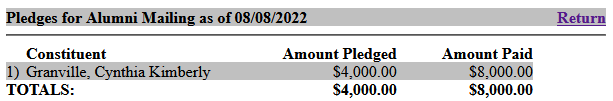
DE Pledges by Event
The DE Pledges by Event report lists pledges that have been made by the event they're connected to. The report can be filtered by the Event, Fund, and Pledge Date range. A single individual can be selected using the ID field. Click on an Event to see a breakdown of the details.
DE Receipt Mail Merge
The DE Receipt Mail Merge report lists the contact information for donors along with their gift amounts and the event so they can be mailed receipts for their donations. The report can be filtered by Campus, Division, Department, and the Begin and End date range. XLS only.

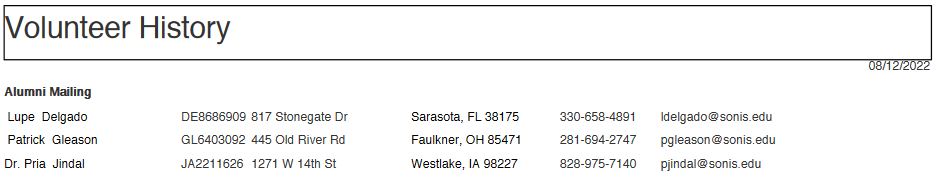
DE Volunteer History
The DE Volunteer History report displays fundraising activities opportunities that constituents have participated in. The report is based on the user's Volunteer record and can be filtered by Event, Constituent Type and Volunteer Start Date range. A single individual can be selected using the ID field. PDF or Excel file.
Miscellaneous "D" Reports
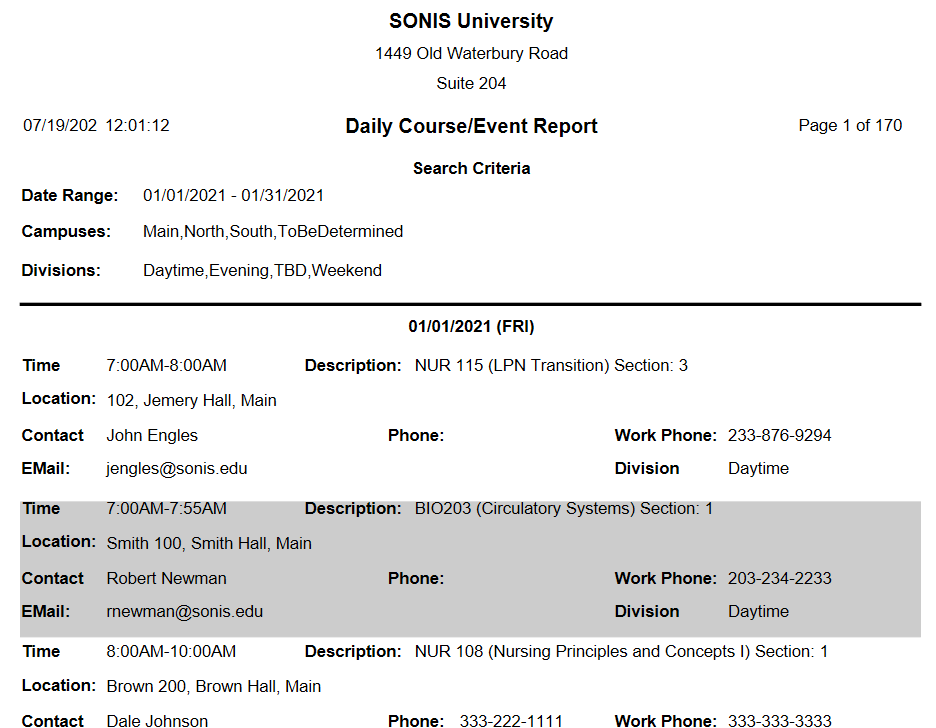
Daily Course/Event Report
The Daily Course/Event Report is designed to provide an overview of the events that are taking place on campus. The report is sorted by day and includes details about the event and the organizer, which would be the primary instructor if the event is a course. The report can be filtered by Campus, Division, and Date Range. The date range is limited to a maximum of 31 days.
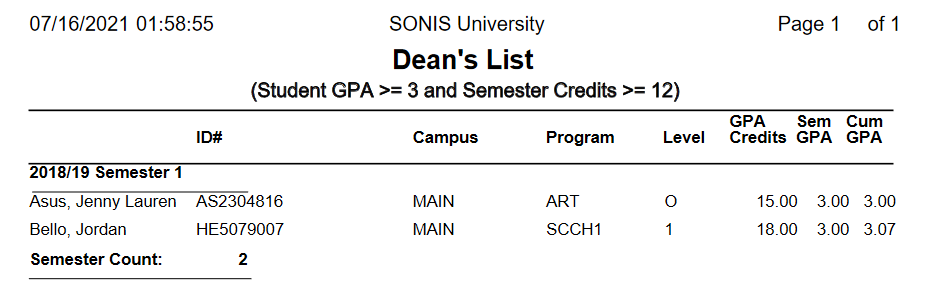
Dean's List
The Dean's List report displays students who have made the institution's dean's list based on the GPA requirements based on the settings in the Honors/Probation Requirements utility. The report can be filtered by Campus, Division, Department, School Year, Semester, Program, and Level. Administrators can choose to display the student's social security number on the report or to leave it off for security reasons. The report is available as a PDF or an Excel file.
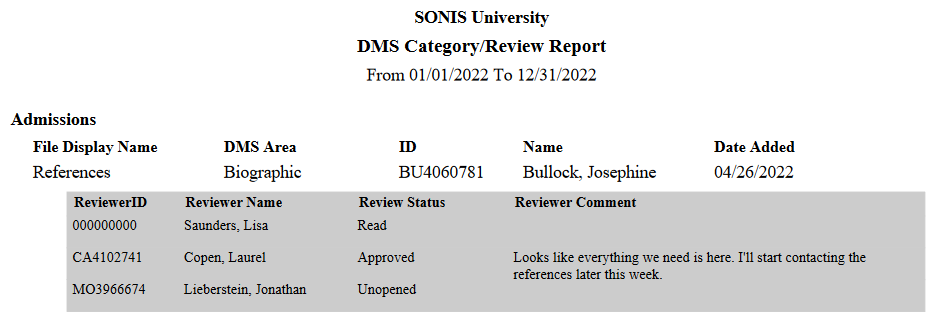
DMS Category/Review
The DMS Category/Review report lists documents that have been uploaded to the Document Management System sorted by the assigned category and the user that the file is associated with. The results can be filtered by Campus, Division, Department, Module Status, Program, and Level as well as by the DMS Category Name. The report also displays feedback notes and review status where applicable. Click the above link for more details.
Education Data
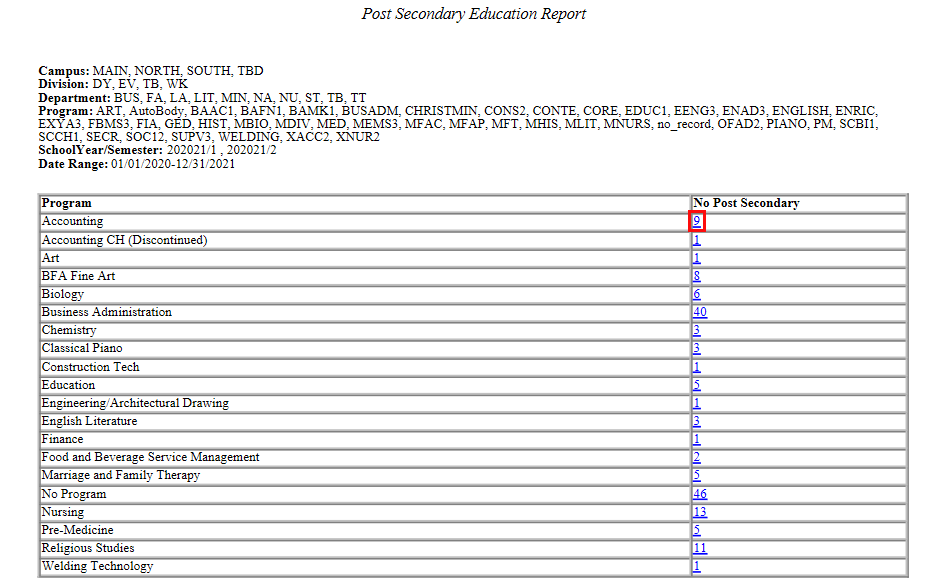
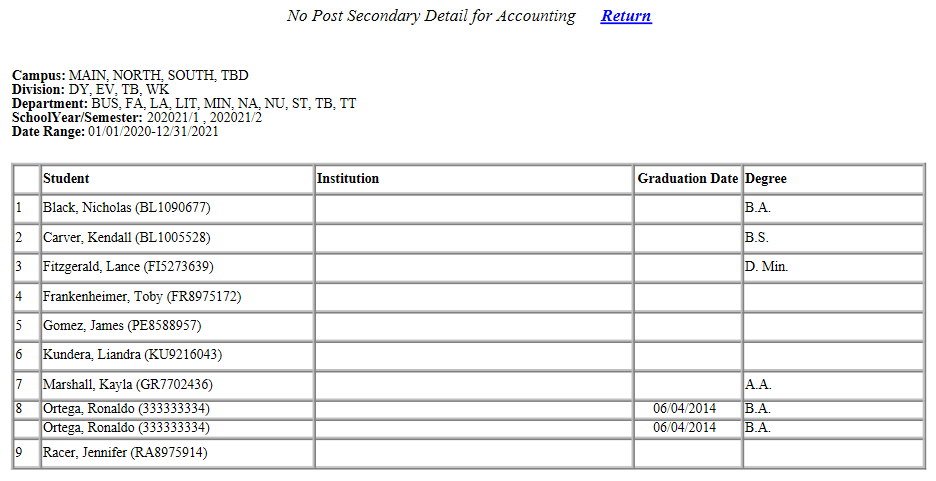
Education - Post Secondary
The Education - Post Secondary report lists the post-secondary programs from users' education record. The results can be filtered by Campus, Division, Department, Program, School Year/Semester, and Enrollment Dates. Each program is listed alphabetically with the number of students enrolled. Click on a number to drill down and see the students associated with that program.
Education Background
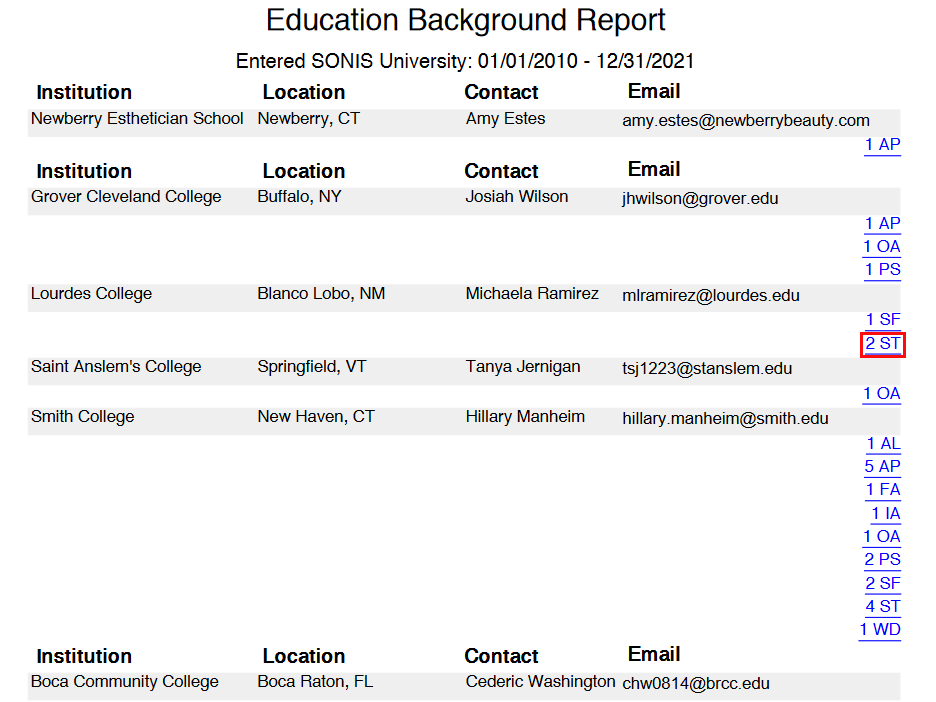
The Education Background report lists institutions based on the SONIS users connected to them as a previous high school or college. The report can be filtered by Module Status and/or Institution Code as well as by the Enter Date. It displays each institution separately and lists the SONIS number users represented by each module status, Prospect, Applicant, Student, Online Applicant, Alumni, Withdrawn, Staff, Faculty, Constituent, CE Student, Default Management, and Inactive. Click on a module status to download an Excel file with a breakdown for each individual module status connected to the institution.

Education Background Expanded
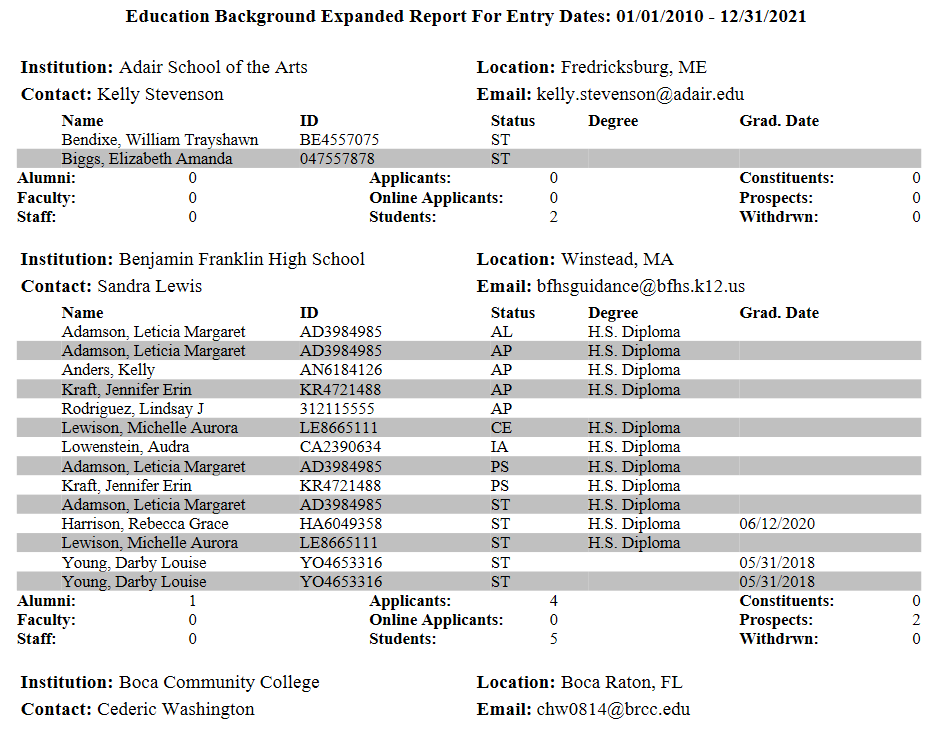
The Education Background Expanded report provides a detailed breakdown of each institution in the SONIS system, including the SONIS users that are associated with it. The report can be filtered by Module Status and/or Institution Code as well as by the Enter Date. Available as a PDF or an Excel file.
Education History
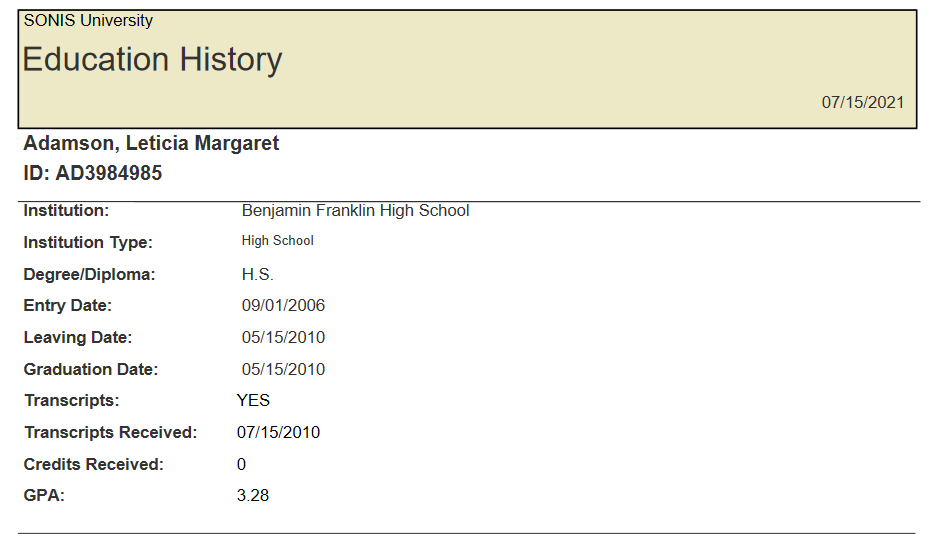
The Education History report provides a detailed breakdown of each student's education history, including graduation date, GPA, etc. The report can be filtered by Campus, Division, Department, and Module Status. Available as a PDF or an Excel file.
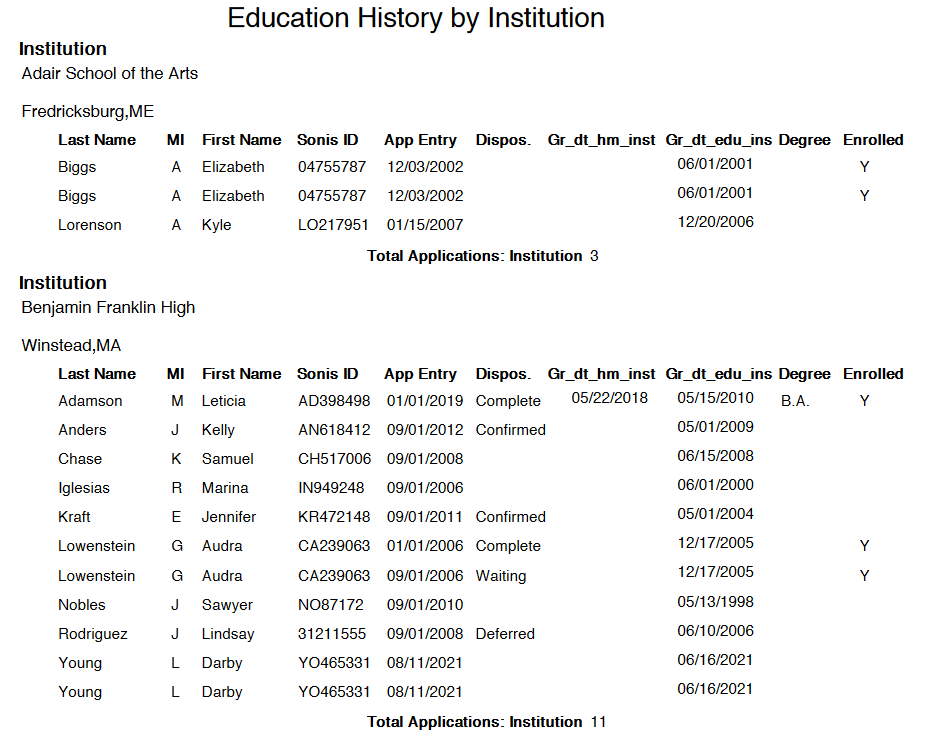
Education History by Institution
The Education History report lists Jenzabar SONIS users by their high school or previous college. The report can be filtered by Entry Date and/or Institution Type Code. In Available as a PDF or an Excel file.
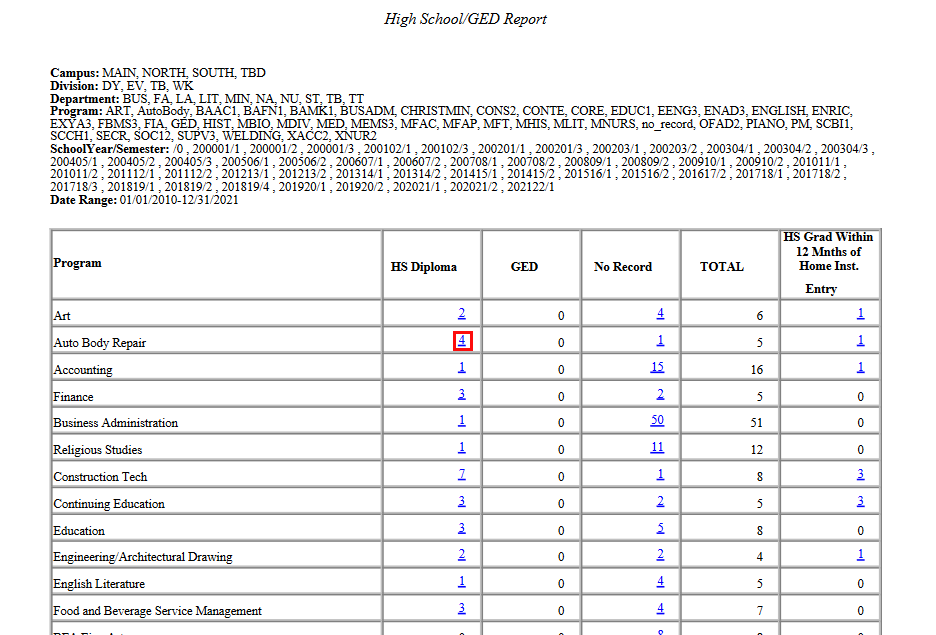
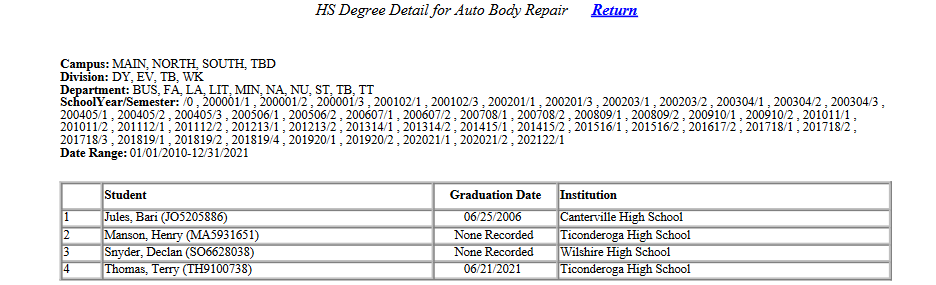
Education HS GED
The Education High School & GED report displays a list of students by program along with their high school diploma or General Educational Development certification records. These records are added and maintained through the student's Education record. The report can be filtered by Campus, Division, Department, School Year, and/or Program. The report requires a Begin Date and End Date range. PDF only.
Click on a link to view a list of students in that category.
Employment
Employer Overview
Employment by Company
Employment Interviews
Enrolled Students
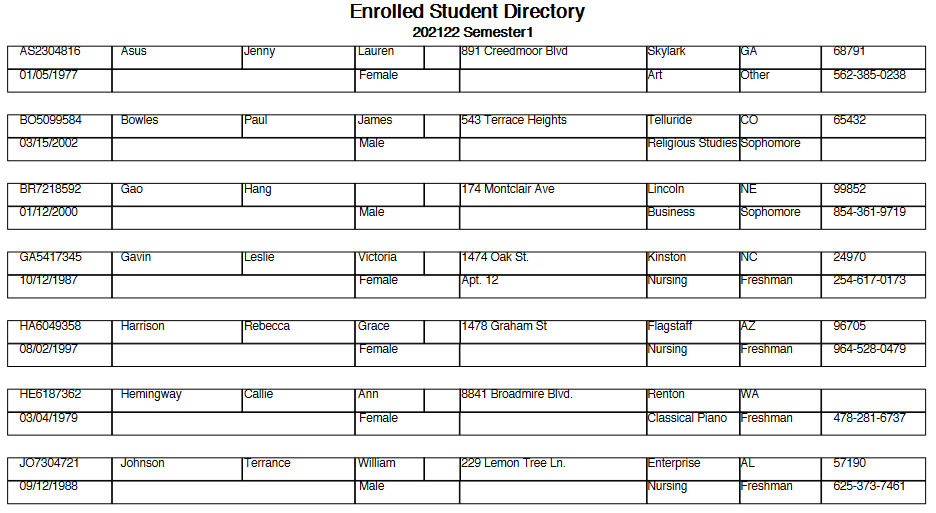
Enrolled Student Directory
The Enrolled Student Directory report displays all currently enrolled students for the chosen School Year and Semester. Each listing includes the student's Primary Address details. The report can be filtered by Campus, Division, Department, Program, and Level. Administrators can also choose to view only the students assigned to a particular advisor, though this is optional. Available as a PDF or an Excel file. See Enrolled Student Listing for more details.
Enrolled Student Listing
The Enrolled Student Listing report displays all students enrolled in courses at the home university. The report outputs one school year and semester at at time and can also be filtered by Campus, Division, Department, Program, Level, and Entry Date. Click here for more details
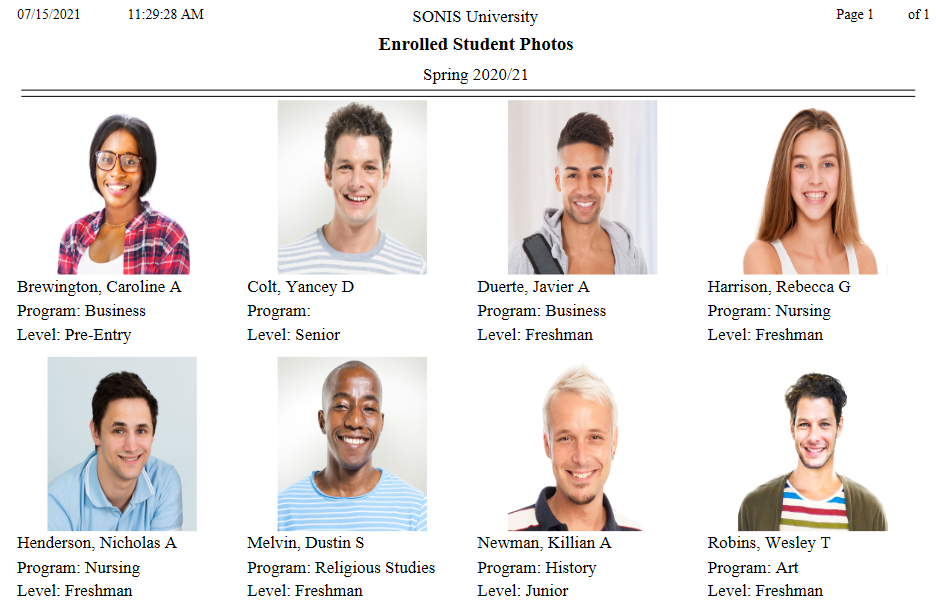
Enrolled Student Photos
The Enrolled Photos report displays all currently enrolled students who have a photo on file. Photos can be uploaded from the Biographic page. The report can be filtered by Campus, Division, Department, Module Status, and Level.
Enrollment
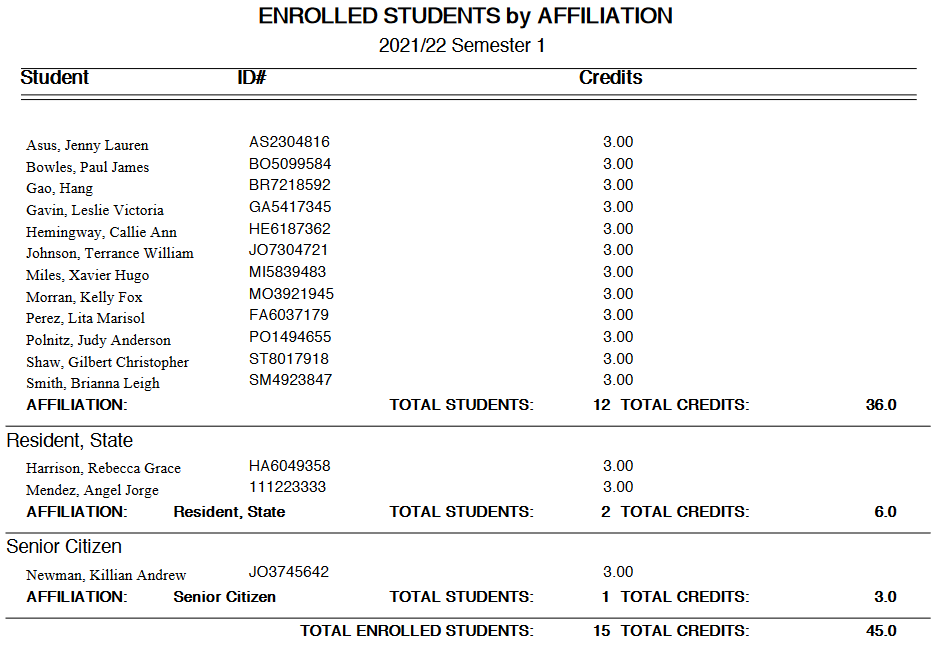
Enrollment by Affiliation
The Enrollment by Affiliation report displays enrolled students organized by the school year and semester and their Affiliation. The report can be filtered by Campus, Division, Department, School Year, Semester, Program, and Level. Administrators can also enter an optional As of Date. Available as a PDF or an Excel file.
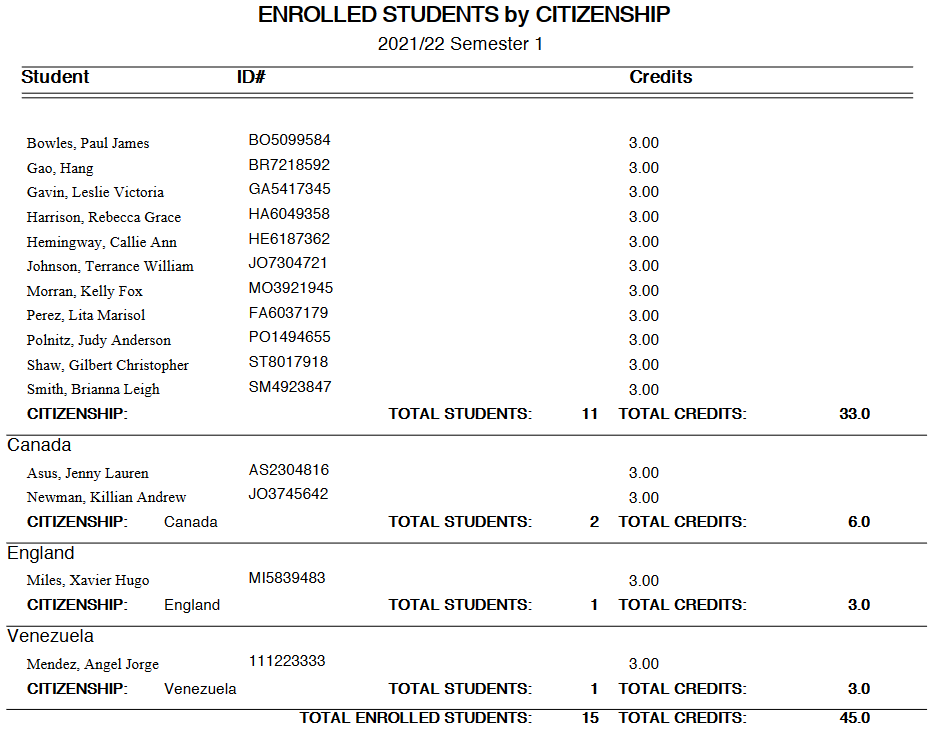
Enrollment by Citizenship
The Enrollment by Citizenship report displays enrolled students organized by their visa country. Only students who have visa information entered on the Citizenship page are listed by country. Students without this data are listed separately in an unlabeled group. The report can be filtered by Campus, Division, Department, School Year, Semester, Program, and Level. Administrators can also enter an optional As of Date. Available as a PDF or an Excel file.
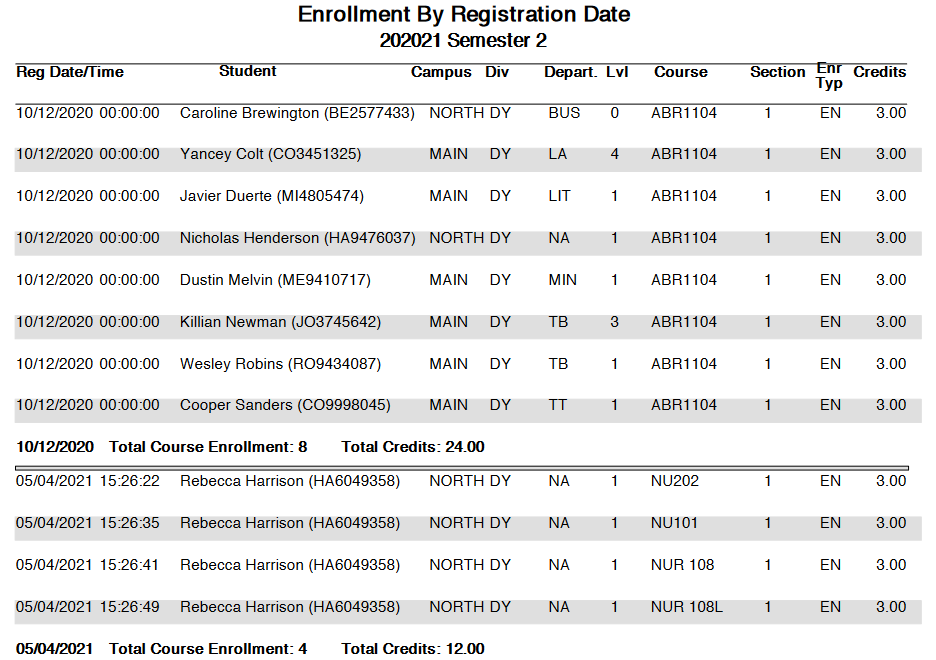
Enrollment by Date
The Enrollment by Date report displays enrolled students organized by the date they registered. The report can be filtered by Campus, Division, Department, School Year, Semester, Program, and Level as well as by the Enrollment Date range. Available as a PDF or an Excel file.
Enrollment by Enrollment Type
The Enrollment by Enrollment Type report displays enrolled students organized by their enrollment type. The three enrollment types are standard enrollment, CE enrollment, and auditing. The report can be filtered by Campus, Division, Department, School Year, Semester, and Level. PDF only.
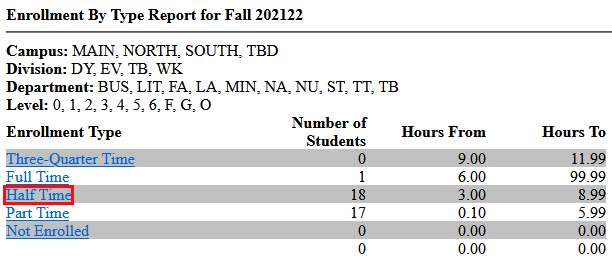
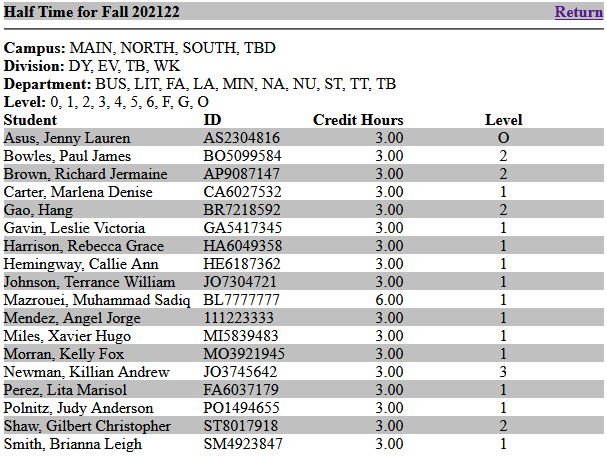
Enrollment by Type
The Enrollment by Type report displays enrolled students organized by their enrollment status. Enrollment status is set in Table Maintenance and is determined by the number of credit hours that the student is taking. The report can be filtered by Campus, Division, Department, and Level. A single School Year and Semester must be selected. Administrators can choose to Include CE enrollment or to leave it off the report. PDF only.
Click on an enrollment status for a list of students with that status.
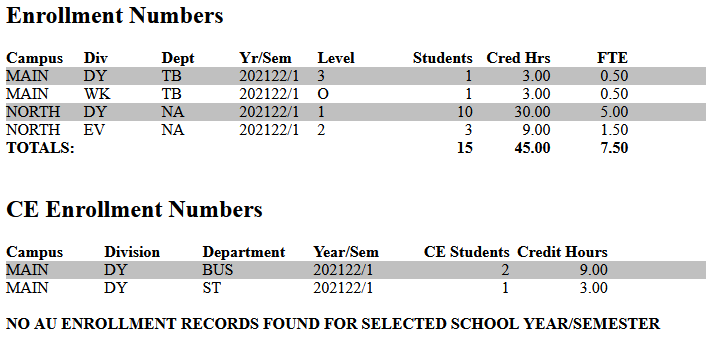
Enrollment Details (Used for IPEDs)
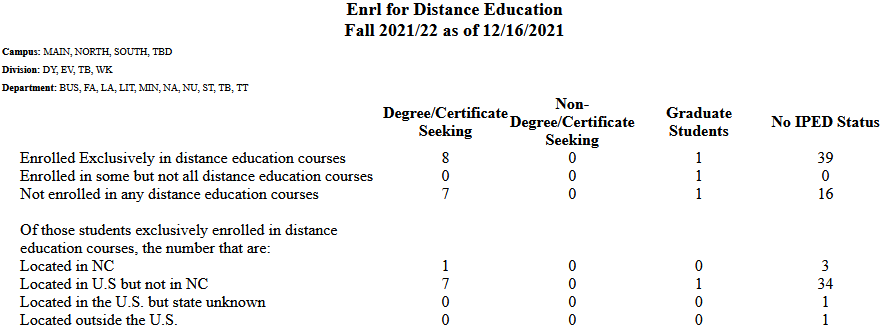
Enrollment for Distance Education
The Enrollment for Distance Education report displays a breakdown of currently enrolled students by their participation in distance ed courses. Courses can be designated as Distance Education courses by checking the corresponding box on the Section: Edit page. The report can be filtered by Campus, Division, and Department. A single School Year and Semester must be selected. An optional As of Date can be used as an additional filter. PDF only.
Enrollment Summary by Program
Enrollment Summary by Program without Matriculation
Enrollment Unduplicated Headcount
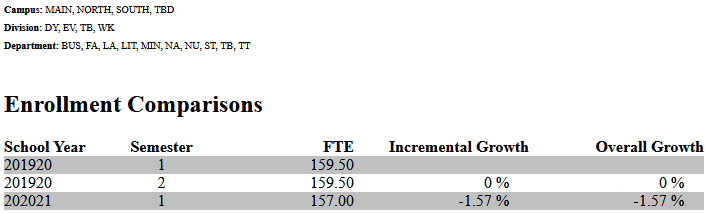
Enrollment Comparison
The Enrollment Comparison report displays full time enrollment numbers and the growth from one semester to the next. Full time enrollment numbers are based on enrollment status, which is set in Table Maintenance. The report can be filtered by Campus, Division, Department, School Year, and Semester. In order for growth numbers to display, more than one School Year and/or Semester must be selected. PDF only.
Enrollment Data Collection Report
The Enrollment Data Collection utility is a Jenzabar SONIS feature that allows institutions to collect a wide array of enrollment data that can then be used for state reporting, analytics, or other functions. A separate setup utility allows for alternate data collection, either on a field by field basis, or with an extended file that can collect additional fields. Visit the Enrollment Data Collection Help Hub page for more information.
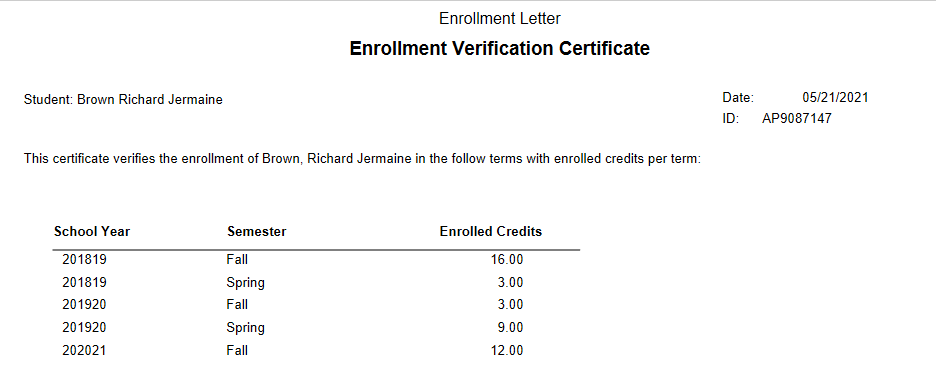
Enrollment Letter
The Enrollment Letter report displays a list of each student who is enrolled along with their enrollment hours in each school year/semester. The results can be filtered by Campus, Division, Department, and/or Cohort. The results can also be filtered by List ID. For more about lists, visit the List Management Utility page. Additionally, users can select an Advisor to view only students assigned to that advisor.
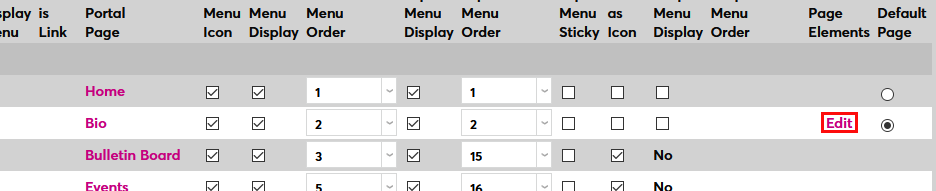
The report can also be added to the student portal. To activate this feature, navigate to the Portal Menu Utility under the Systems menu. Select Student .

On the next page, click the Edit link for the Biographic portal page under the Page Elements column.
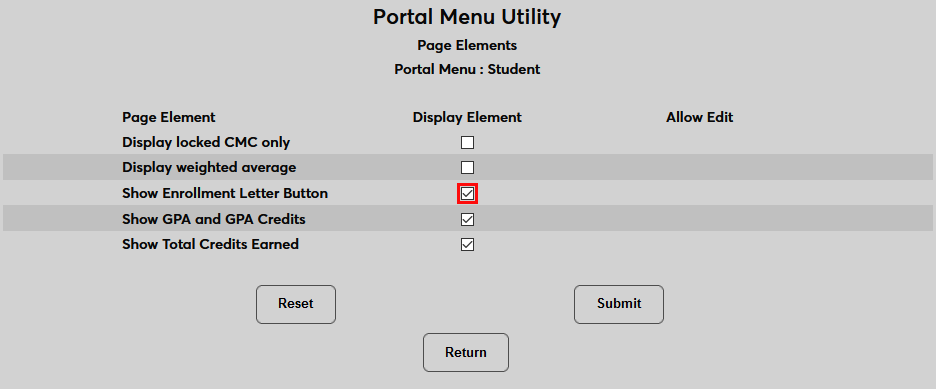
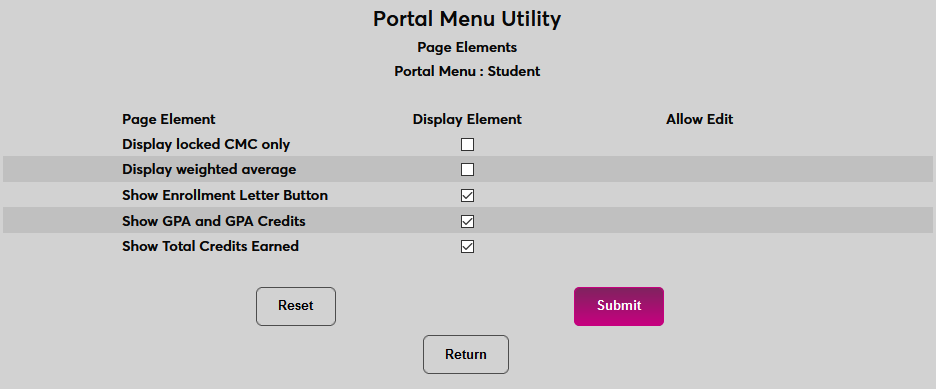
Check the Show Enrollment Letter Button box and click Submit .
Once this change has been made, students can access their personal enrollment letter by clicking the Enrollment Letter button on their Bio page.
Evaluations
Evaluations by Individual
Evaluations Summary
The Evaluations Summary report gives the user the ability to get the averages for a selected evaluation by School Year and Semester so that a comparison can be made between the results for an individual course section and all course sections assigned that same evaluation.
It is located under Reports/Evaluations Summary. The summary is of those evaluation questions that can be counted such as multiple choices, radio buttons, or numbers. Text answers cannot be summarized in any meaningful way.
The Department filter, Select department(s), filters on the department of the student (not the course). This allows a comparison to be made between evaluations completed by students majoring in that subject and students not majoring in that subject.
Evaluations: Course Evaluation Results
Miscellaneous "E" Reports
Eligibility Report
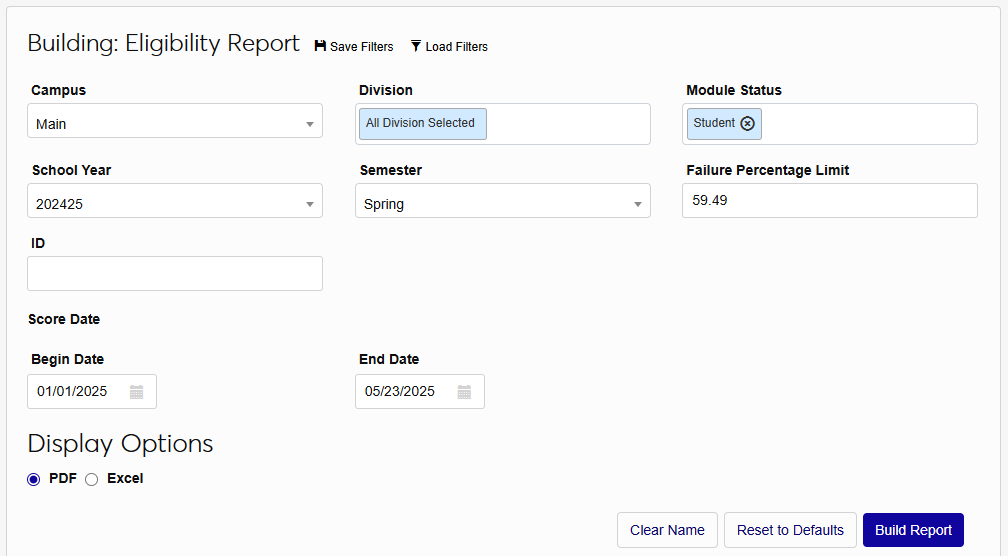
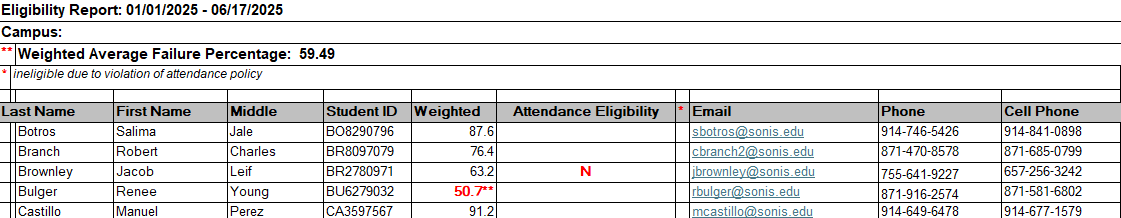
The Eligibility Report displays students' eligibility for sports and other events based on their weighted grade average based on the scores they've received in their current courses. The report can only be used by schools that use the SONIS gradebook. Schools that use time period grades can also mark students ineligible on the report based on attendance.
Note
Weighting is based on the element weighting that each instructor sets in each course's gradebook. For example, a course may have five tests that are collectively worth 50% of the grade, eight quizzes that are collectively worth 30% of the grade, and one term paper that's worth 20% of the grade. The report uses this data to weight each element when calculating eligibility.
The report can be filtered by Campus, Division, Module Status, School Year, and Semester. You can also select an individual student using the ID field and set an optional Begin Date and/or End Date, which controls which scores are used to make the calculation. The Failure Percentage Limit is the minimum weighted average that a student must achieve to be eligible and can be edited per school requirements. The report is available as a PDF or an Excel file. The Excel version displays each user's Phone and Cell Phone data from their Address record in additional to the standard fields found in the PDF version.
Emergency Contacts
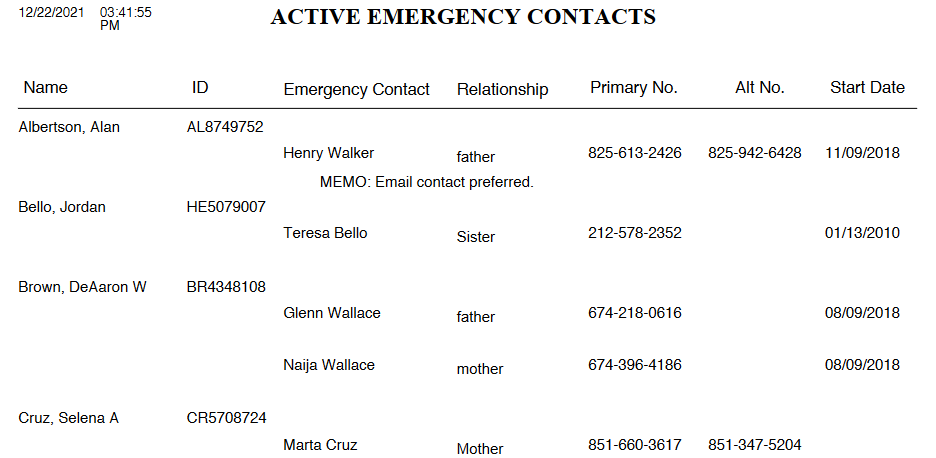
The Emergency Contacts report displays emergency contact information from SONIS users. Emergency contact information is created and maintained via the Emergency Contact Users page. Only active emergency contacts are included. The report can be filtered by Campus, Division, Department, Module Status, and Level. PDF or Excel file available.
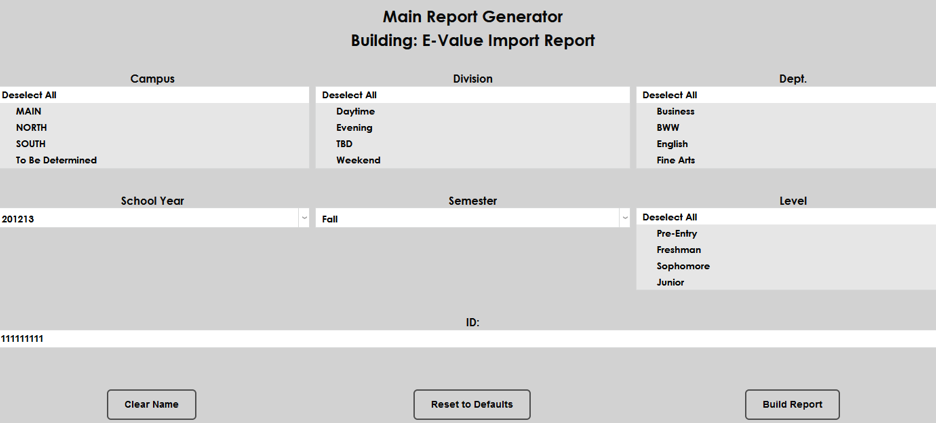
eValue Import
The eValue Import Report allows the user to view results of the import of eValue data to SONIS. The report only selects official grades for display. It is recommended that the Official Grade marking processes are completed prior to running this report.

Exam IDs
The Exam ID report is a listing of records with or without Exam IDs.
Financial Aid
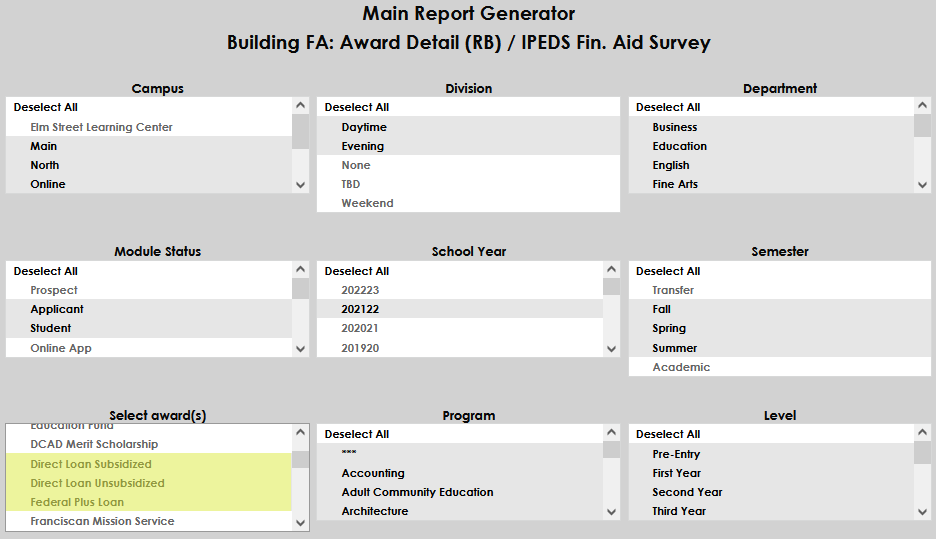
FA: Award Detail (RB)/IPEDS Financial Aid Survey
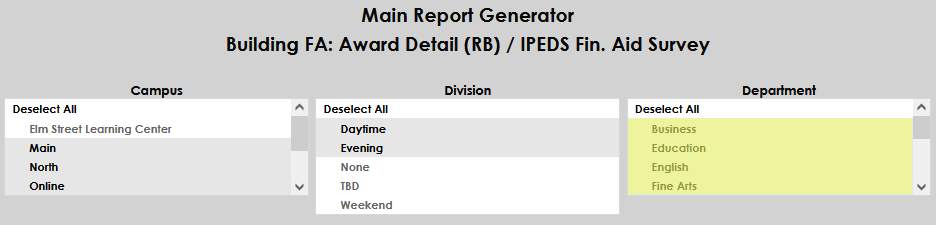
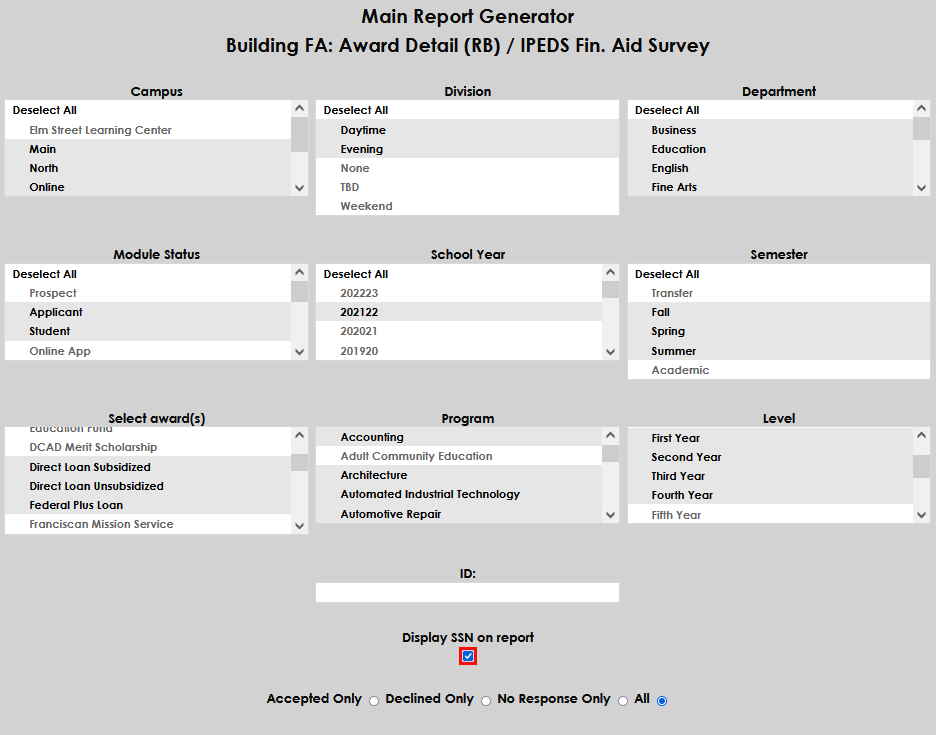
The Award Detail Report is an extension of the Awards Summary report that can be used for the IPEDs Financial Aid Survey. In addition to the typical filters, this report allows the user to filter on only awards accepted, those declined, those to which there has been no response, and all awards. A checkbox under the Display Options heading offers the option to Include disabled awards. With this box checked, all award in the system will appear in the Award Codes dropdown menu regardless of their status.
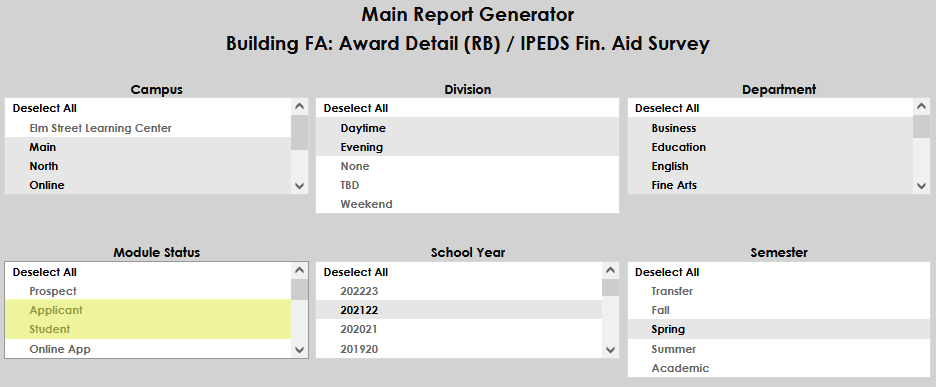
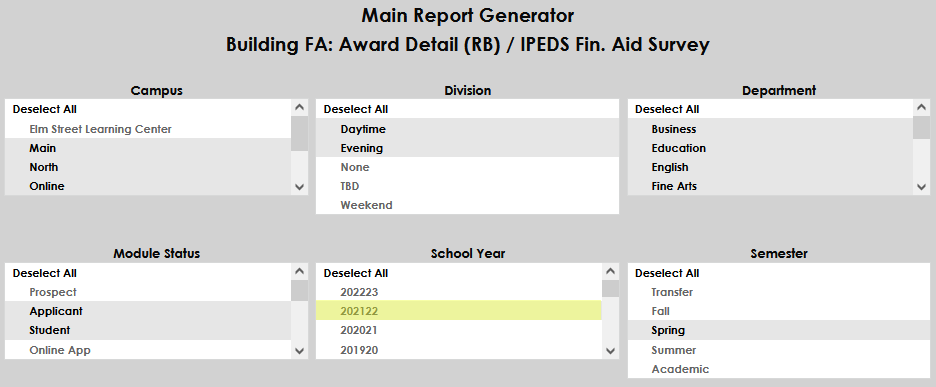
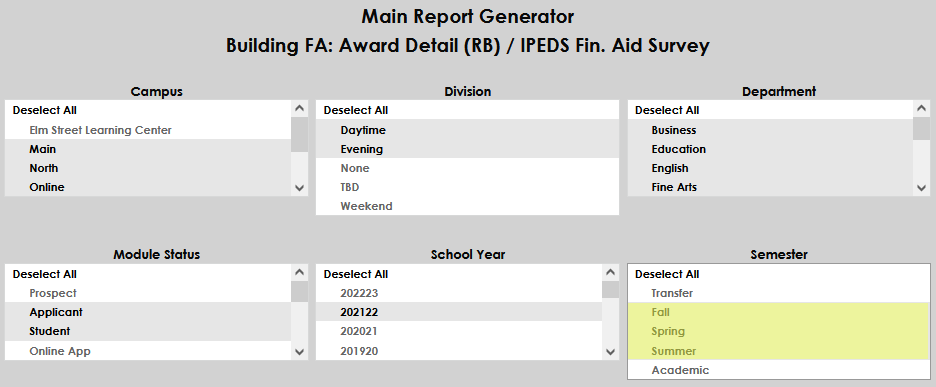
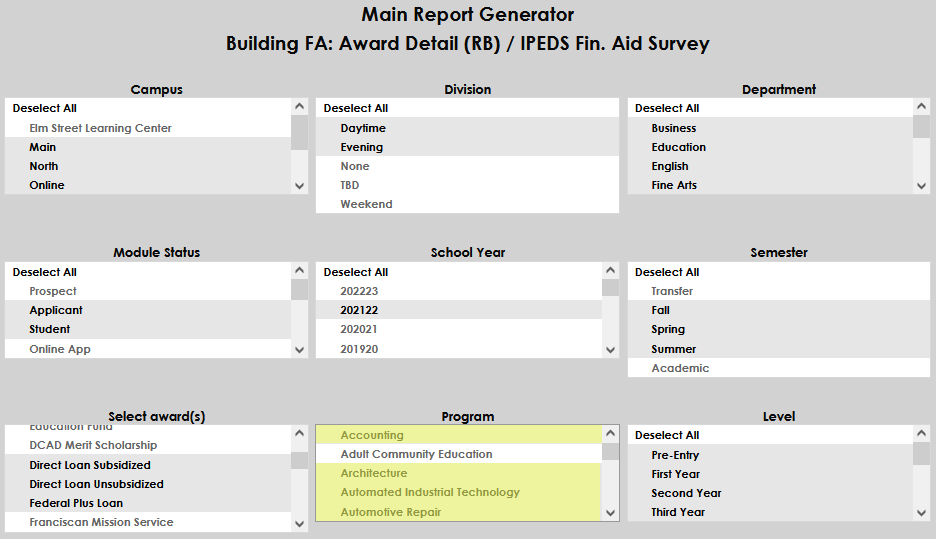
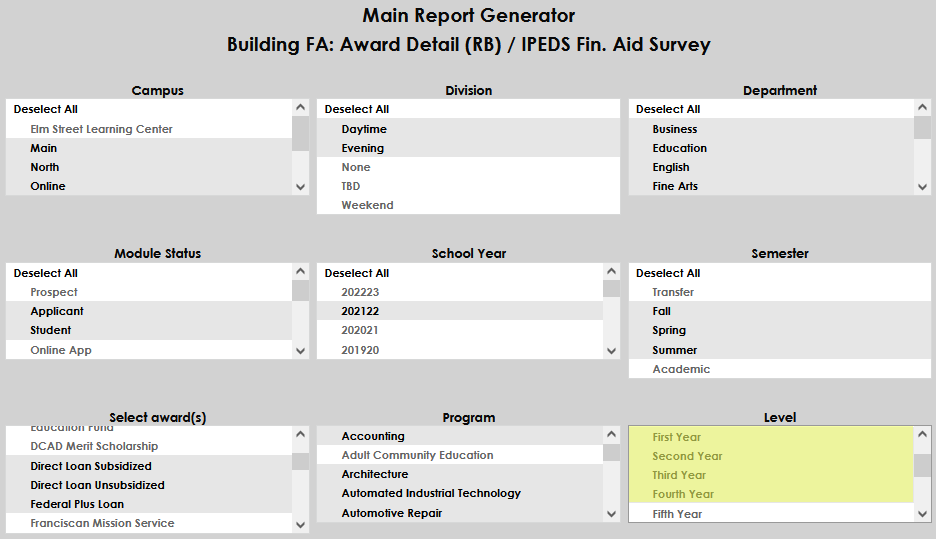
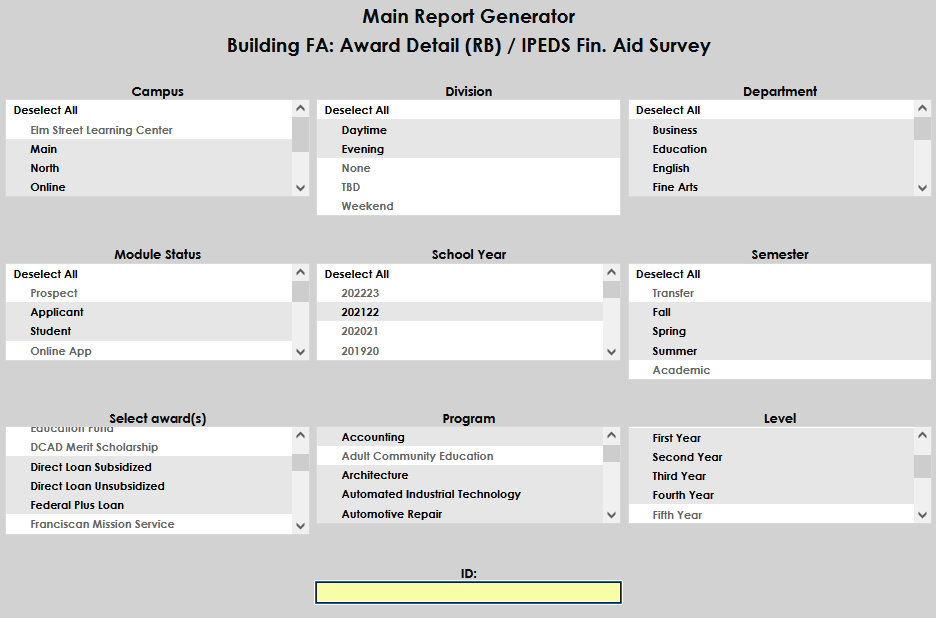
To generate an Award Detail Report, navigate to the Award Detail (RB) page under the Reports tab. Select the appropriate Campus, Division, Department, Module Status, School Year, Semester, Awards, Program, and Level for the query or select a specific student by their ID.
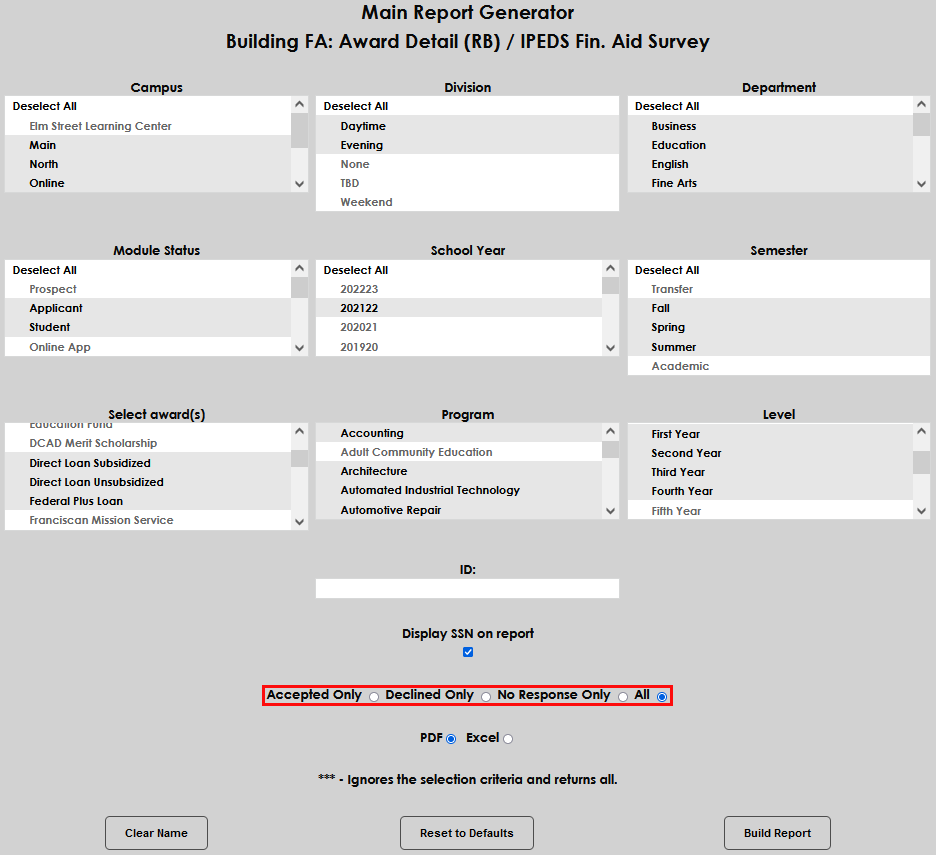
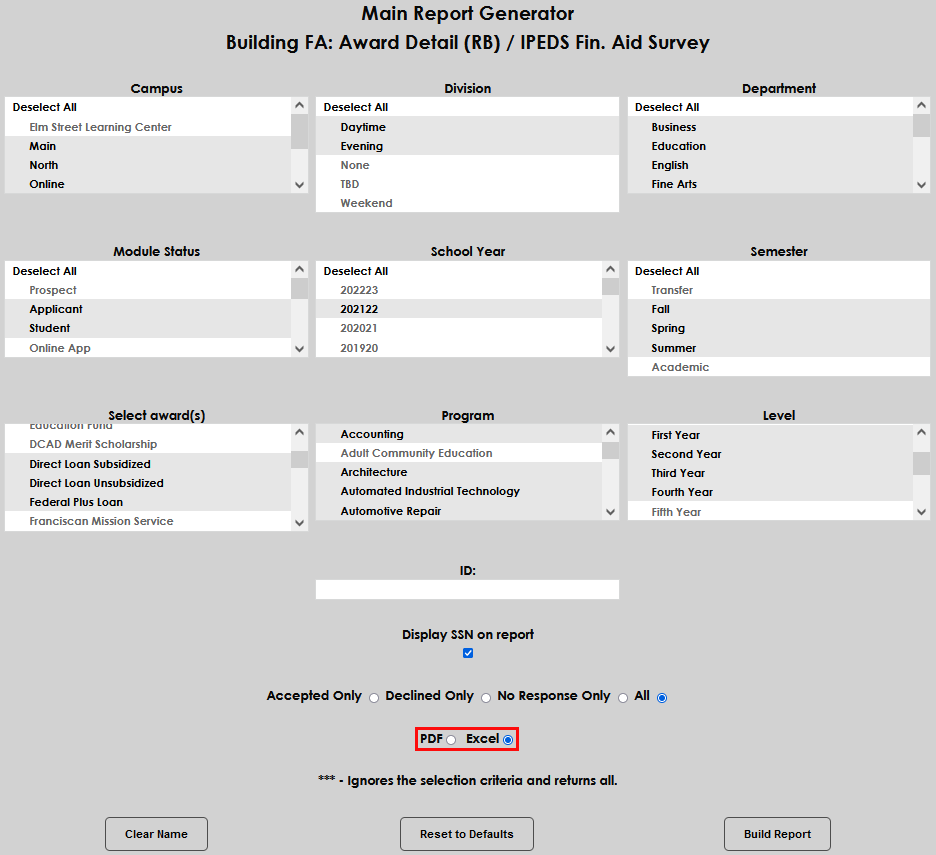
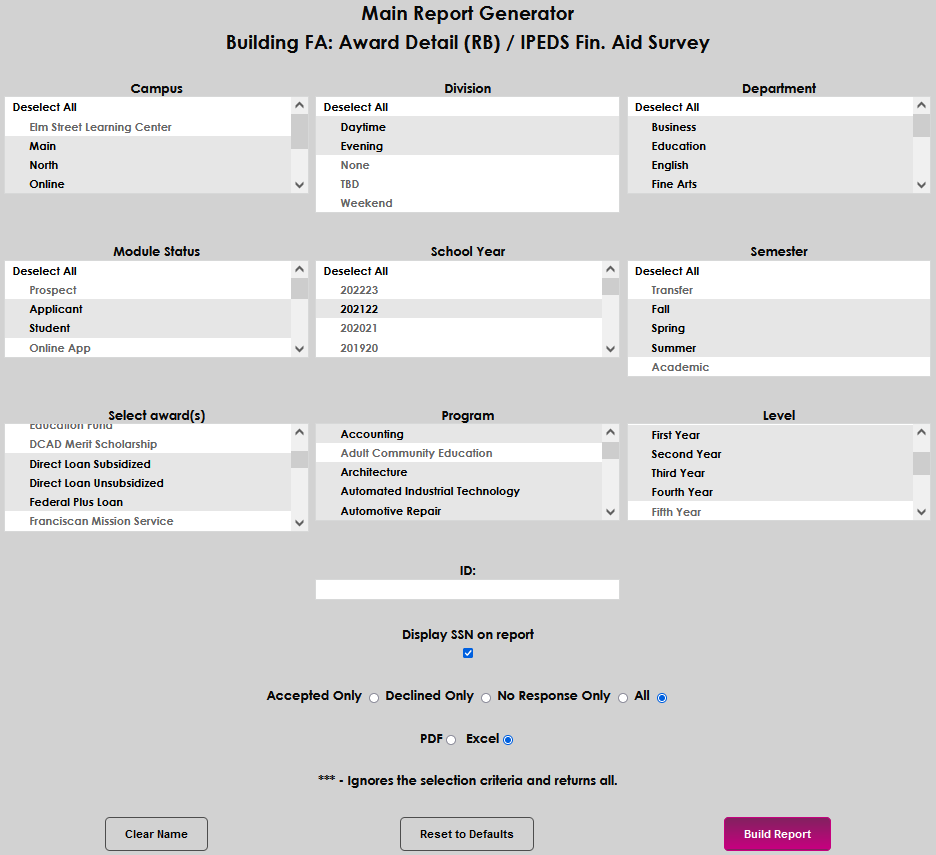
Check the Display SSN on report box of the student(s)' social security number should be visible in the report and choose whether to show Accepted Only, Declined Only, No Response Only, or All loan statuses. Finally, select Excel and click Build Report.
Both the PDF output and Excel output offer the following columns:
Column Header | Explanation |
Original Amount | This is the amount of the Award when it is originally offered to a student. |
Amount Offered | This is the same amount as the "Original Amount" until it is accepted. Afterwards, it may change if the student accepts a different amount. |
Offer Status | This shows the student's decision as it pertains to the award. |
Loan Fees | If the award is a loan and there are fees attached, those appear here. |
Award Received | This shows the amount of the award that the student has actually received. |
Excel Only
The following fields are available in the Excel output only:
Column Header | Explanation |
Budget | The amount of money the student will require for the term in question, generally including housing, books, etc. |
EFC | The student's expected family contribution. |
Need | The budget minus the EFC. |
Remaining Need | The need minus the financial aid already received. |
Adjusted Gross Income | The post-tax income for the student's family. |
Pell Eligibility Flag Status | The student's eligibility for Pell grants. Calculated automatically by SONIS. |
GPA | The student's cumulative grade point average. |
Total Credits Received | The number of credits the student has earned to this point in their academic career. |
Semester Credits | The number of credits the student is registered for at the time of the report. |
Met Application Deadline | Whether or not the student met the deadline to apply for financial aid. |
Anticipated Graduation Date | The date when the student is expected to graduate. |
Verification Status | An ISIR indicator. |
Loan Entrance Date | The date that the student's loan begins. |
Loan Exit Date | The date that the student's loan ends |
Accept/Decline Date | The date on which the student accepted or declined the award. |
Accept/Decline Operator | The SONIS ID of the student or staff member who processed the acceptance/decline transaction. |
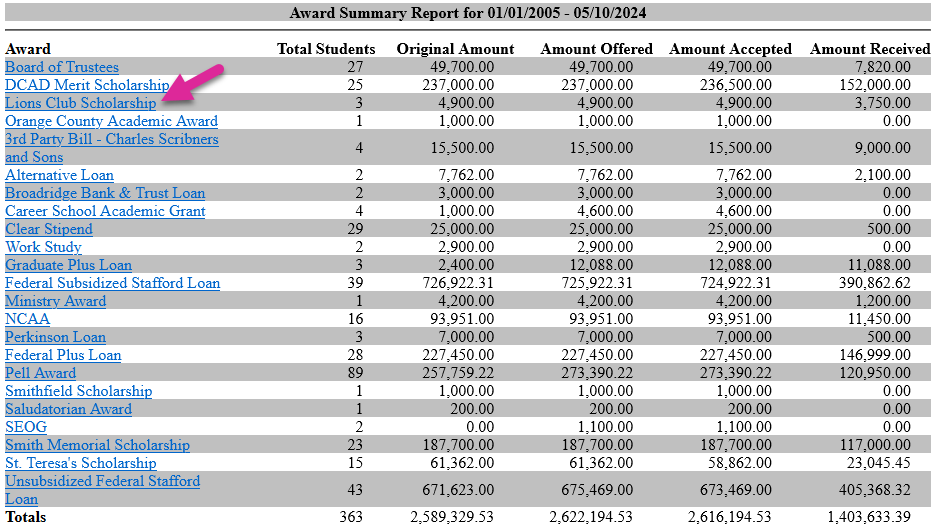
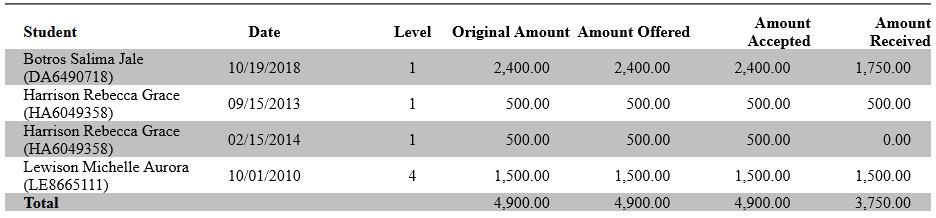
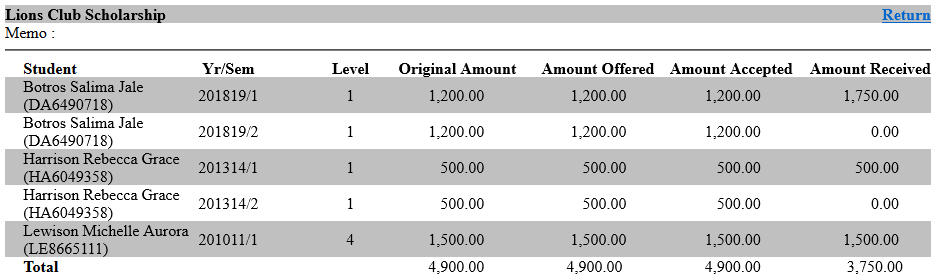
FA: Awards Summary
The Awards Summary report provides an overview of key financial aid totals for each award offered by your school. You can see how many students have been awarded, the original amount offered, the updated amount offered, the amount accepted, and the amount received. The report only displays one school years at a time, but you can select multiple semesters. You can view all awards or narrow down the list using the Award Code menu. A checkbox under the Display Options heading offers the option to Include disabled awards. With this box checked, all award in the system will appear in the Award Codes dropdown menu regardless of their status. Other filters include the Campus, Division, Department, and Level. Available as a PDF or an Excel file.
When viewing the PDF version of the report, you can drill down to see a list of each student who received the award. Check the Show Cumulative GPAs box and click the Submit button to see each student's current cumulative GPA.
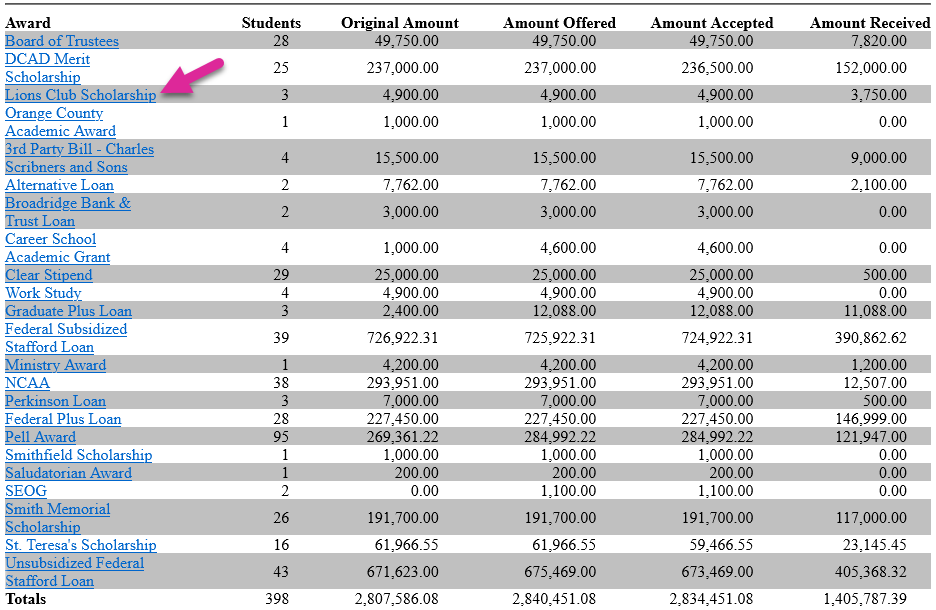
FA: Awards Summary by Date
The Awards Summary by Date report provides an overview of key financial aid totals for each award offered by your school based on the selected date range. You can see how many students have been awarded, the original amount offered, the updated amount offered, the amount accepted, and the amount received. You can view a single year/semester or select multiple. You can view all awards or narrow down the list using the Award Code menu. Other filters include the Campus, Division, Department, and Level. A checkbox under the Display Options heading offers the option to Include disabled awards. With this box checked, all award in the system will appear in the Award Codes dropdown menu regardless of their status.
Once you've built the report, you can drill down on any award to see a list of all the students who have received the award by date.
FA: Awards Summary for Multi Year/Semester
The Awards Summary for Multi-Year/Semester report provides an overview of key financial aid totals for each award offered by your school based on the selected school year(s)/semester(s). You can see how many students have been awarded, the original amount offered, the updated amount offered, the amount accepted, and the amount received. You can view a single year/semester or select multiple. You can view all awards or narrow down the list using the Award Code menu. Other filters include the Campus, Division, Department, and Level. A checkbox under the Display Options heading offers the option to Include disabled awards. With this box checked, all award in the system will appear in the Award Codes dropdown menu regardless of their status.
Once you've built the report, you can drill down on any award to see a list of all the students who have received the award by school year and semester.
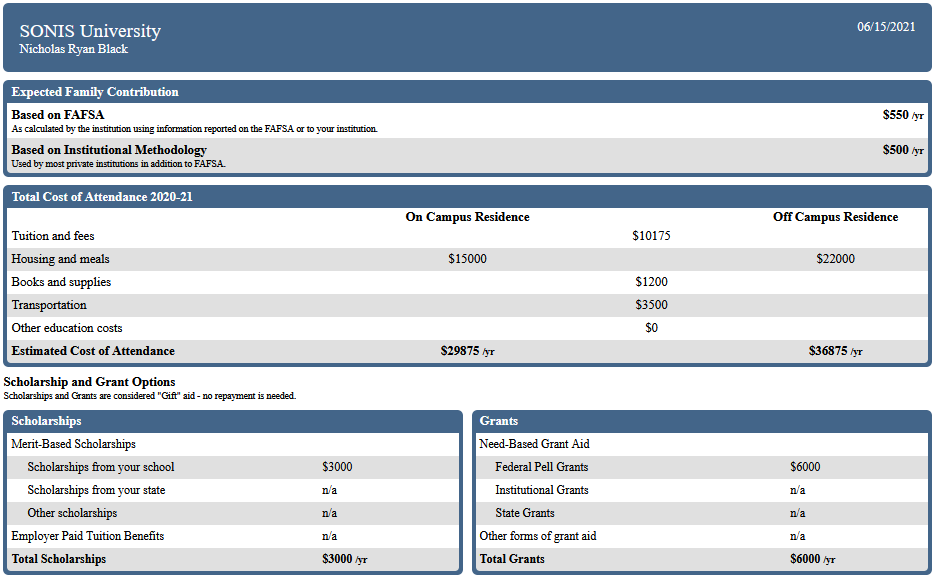
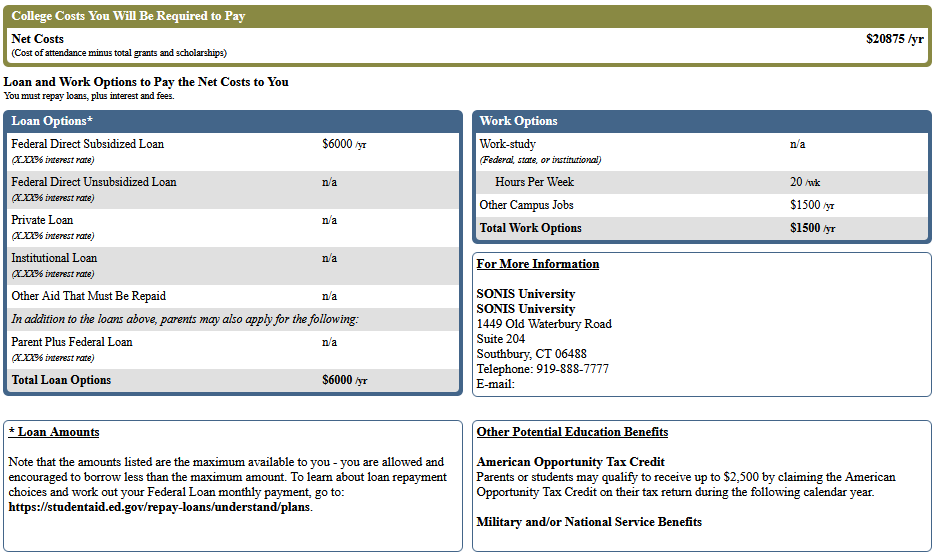
FA: College Financing Plan
This report is provided to give applicants or students an overview of the costs associated with attending an institution, as well as the financial aid they may be able to receive. It requires FAFSA data, utilizes the Department of Education's College Financing Plan template, and provides the same financial aid and institutional information, in the same format. The report displays potential aid to applicants and students who have not been awarded. The report displays the student's awarded aid with default values. The report is run on-demand and may be printed and mailed or saved and emailed to the recipient. It is not currently available in the Applicant or Student Portal. The College Financing Plan must be set up before the report can be used.
Running the Report
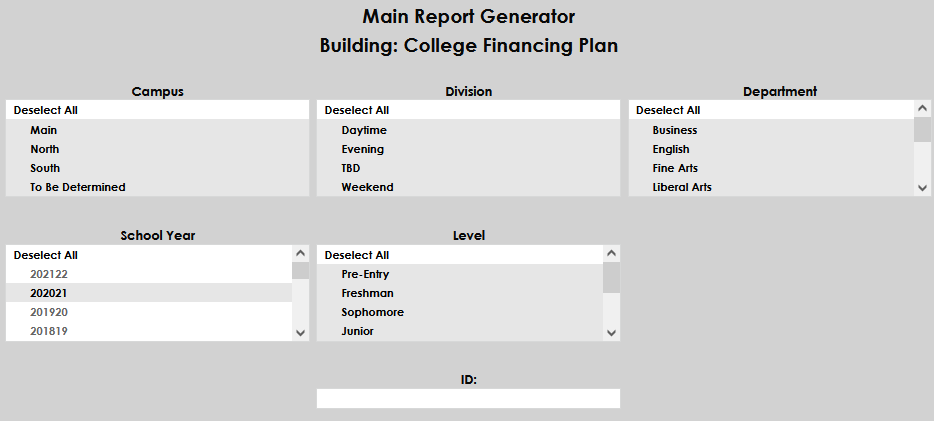
From the Reports menu, select College Financing Plan. The report can be run by Campus, Division, Department, School Year, Level, and ID, or a combination of these options. The values that display in each dropdown are specific to each SONIS member institution's setup and use. After choosing the desired options, select Build Report.
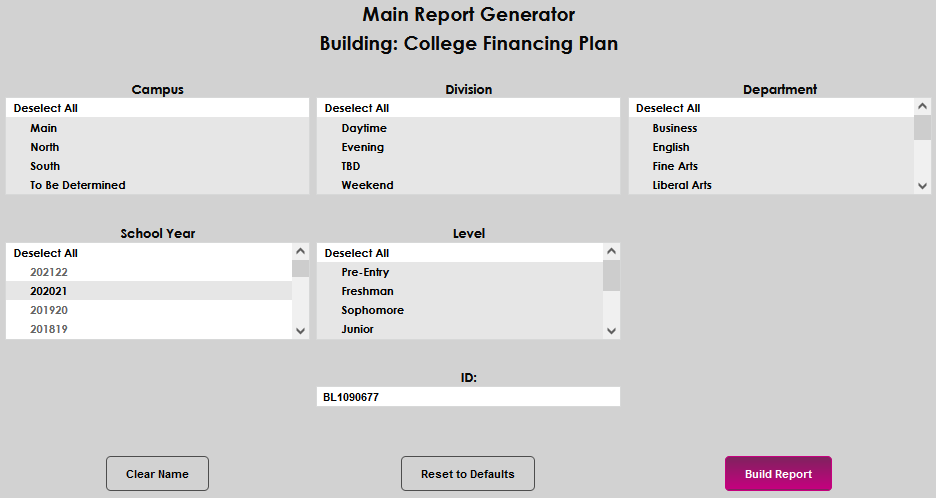
On the College Financing Plan screen, select Preview Report . The requested report will open in a separate window. When the report is displayed, it can be printed for handing or mailing to a recipient, or a screenshot may be taken and electronically mailed.

FA: Financial Aid Report
FA: Financial Aid Transcripts
FA: FISAP Part II
FA: FISAP Part VI
FA: Need Distribution Report
FA: Title IV Detail
FA: Title IV Summary
FA: Transcript Verification Listing
Miscellaneous "F" Reports
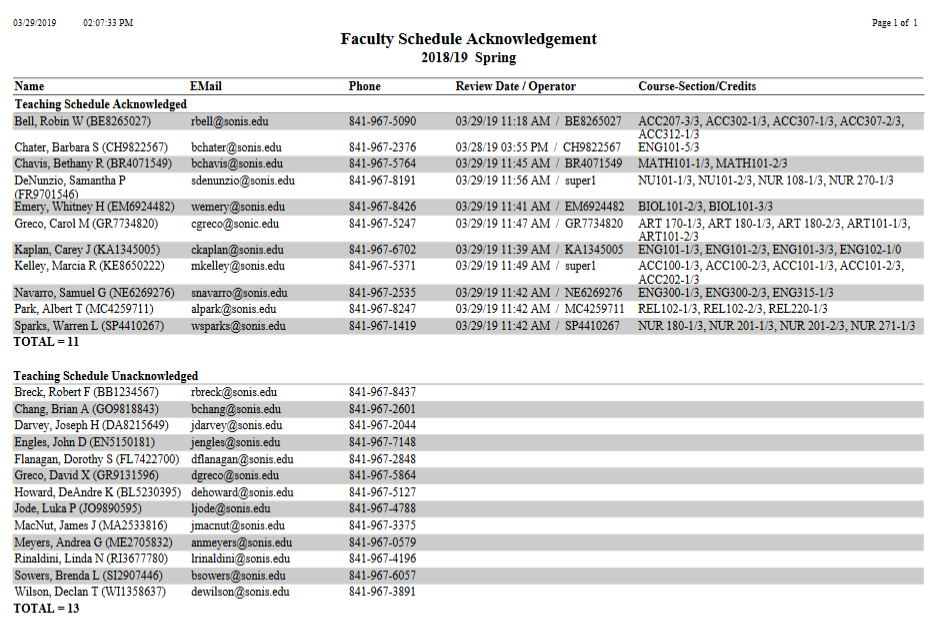
Faculty Schedule Acknowledgement
The Faculty Schedule Acknowledgement report is tied to the Use Faculty Schedule Acknowledgement setting in Web Options. When this setting is activated, faculty members will be asked to acknowledge their teaching schedule each semester. The report displays faculty members who have and have not acknowledged their teaching schedule along with the date, the operator, and the faculty member's contact information. The report can only be run for a single school year and semester at a time.
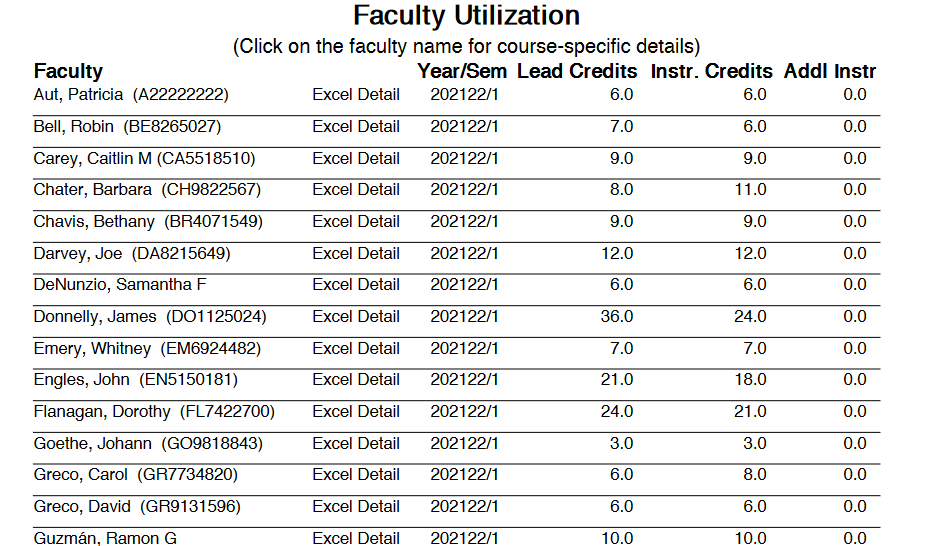
Faculty Utilization
The Faculty Utilization report provides a list of the instruction hours for each faculty member. This information can be used to make adjustments to faculty schedules to prevent overwork and keep underutilized faculty members engaged. Faculty are assigned as Lead Faculty or an Additional Instructor from the Course Section edit page. The report can be filtered by Campus, Division, Department, School Year, and Semester. PDF or Excel file available.
Financials
Form Builder Reports
The Form Builder Reports report displays data gathered from Form Builder forms. The report can be filtered by Campus, Division, Department, Status, or Level or by entering a specific User ID.
The report has columns detailing the number of Total Forms along with forms that have been Submitted, Rescinded, and/or, Disabled.
Clicking on a number will reveal more details about the users who've filled out the forms.
Click Show Form to view an individual user's responses.
GPA
GPA Report Including Transfer GPA
GPAs
Grades
Grade Sheet Attachment
Gradebook Final Grades
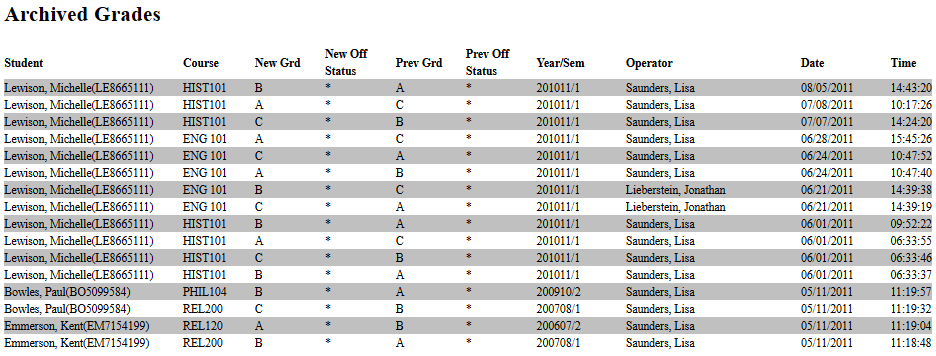
Grades Archived Report
Once a student's grade in a course has been marked as final, it should not be changed under most circumstances. However, there are occasions when changes do need to be made. SONIS offers the ability to track these changes by archiving them.
Three settings are offered in Web Options. The first is No Grade Archiving, which turns off the feature altogether. The second is Archive ALL Official Grade Changes, which does what the name suggests, making an archive entry every time a grade is changed after it has been made official. The third is Archive Non-Transfer Official Grade Changes. This setting creates a record for official grade changes only for home institution courses since transfer grades may need to be changed more frequently.

Once grade changes have been archived, they can be viewed through the Grades: Archived Report , which displays each change that was made along with the date and time and the name of the staff member who made the change. The report can be filtered by Campus , Division , Department , School Year , Semester , and User as well as by the ID of a particular student and by the date range in which the grade was changed.
Grades: High School Time Period
Grades: Input Worksheet Exam ID
Grades: Input WorkSheet(RB)
Grades: Midterm Report
Grades: Semester Grades
Grades: Semester Summary
Grades: Student by Semester
Grades: Time Periods
Grades: View Specific Grades
Graduation Statistics
Grad Placement by Grad Year and Grad Month
The Grad Placement by Grade Year and Grad Month report functions exactly as the Graduate Placement report, but includes the Grad Year and Grad Month as a filter. To populate in the report, the student must have an Employment record with an employment category that is marked as Include in Placement Report in the When Employed table. Students who have been assigned an Employment Waiver Reason on an Education record will not appear, but can be selected for review, if desired. The results display in either PDF or Excel.
Graduate Placement
The Graduation Placement report is provided to assist with monitoring and reporting on placement and employment statistics for the institution. To populate in the report, the student must have an Employment record with an employment category that is marked as Include in Placement Report in the When Employed table. Students who have been assigned an Employment Waiver Reason on an Education record will not appear, but can be selected for review, if desired.
Graduation Rates
Graduation/Attrition
Miscellaneous "G" Reports
Groups
Holds
Holds
Holds by Semester
Housing
Housing
The Housing report allows administrators to view the number of rooms available per dormitory building, as well as the capacity and current occupancy of each. The report can be run by specific campus and building, as well as by year and semester
Housing Requests
The Housing Requests report allows administrators to view student requests for housing. The report filters include campus, division, department, level, ID, activity date, and status (completed or not). The report can be produced in Excel or PDF. The output displays the student name, request date, and any information entered with the housing request, such as room type or roommate characteristics.
Miscellaneous "H" Reports
Health
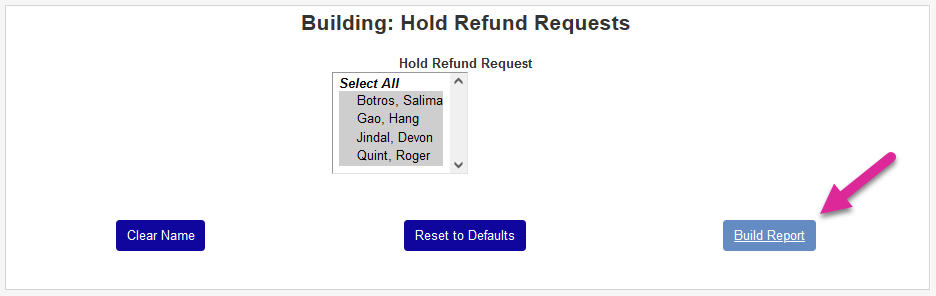
Hold Refund Request
This report displays students who have outstanding hold refund requests. Navigate to Hold Refund Request under the Reports menu to access it. Leave all students selected or unselect one or more and click Build Report to continue.
On the following page, click Preview Report to open the report.
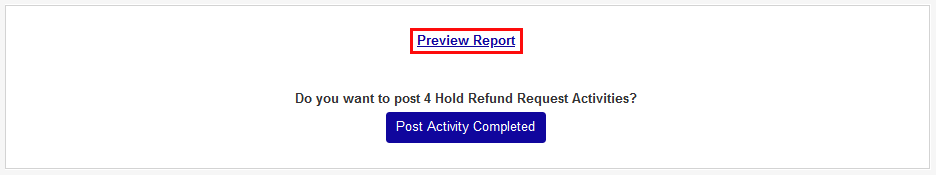
Administrators can also mark hold requests as completed from this page. Click Post Activity Completed to mark the hold requests of all the previously selected students as completed.
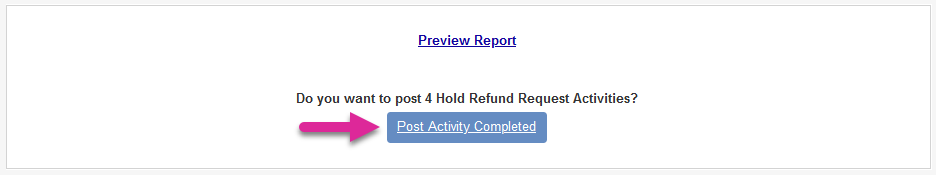
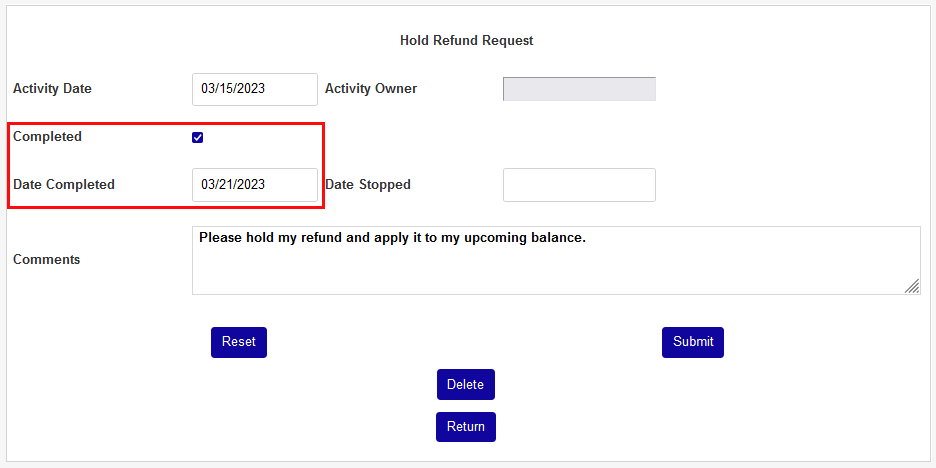
Once requests have been marked as completed, they will no longer appear on the report.
IPEDs Reports
IPEDS 12-Month Enrollment Unduplicated Distance Learning
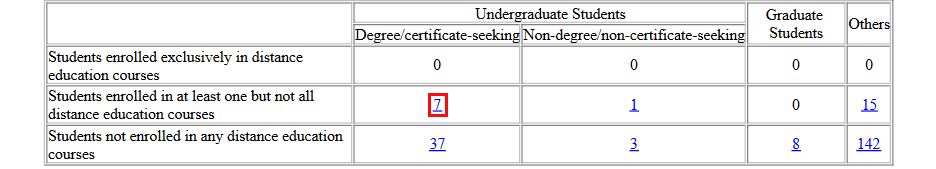
The report will display the same students as the IPEDS 12-Month Enrollment: Enrollment Unduplicated Headcount report, but with a further breakdown based upon enrollment in distance learning coursework, or not. It can be viewed as PDF or Excel and provides a summary of each category of students with the option to click through to view the students in each category.
This report has three categories:
1. Students enrolled exclusively in distance education courses,
2. students enrolled in at least one but not all distance education courses, and
3. students not enrolled in any distance education courses.
Enrollment Type | Undergraduate, Degree/Certificate-seeking | Undergraduate, Non-degree/Non-certificate-seeking | Graduate Students | Others |
|---|---|---|---|---|
Students enrolled only in distance education courses | dist_ed = 1 and iped_stat IN ('FD','OD') | dist_ed = 1 and iped_stat IN ('ND') | dist_ed = 1 and iped_stat IN ('GD') | dist_ed = 1 and iped_stat NOT IN ('FD','OD','ND','GD') |
Students enrolled in at least one distance education course | iped_stat IN ('FD','OD') | iped_stat IN ('ND') | iped_stat IN ('GD') | iped_stat NOT IN ('FD','OD','ND','GD') |
Students enrolled in no distance education courses | dist_ed = 0 and iped_stat IN ('FD','OD') | dist_ed = 0 and iped_stat IN ('ND') | dist_ed = 0 and iped_stat IN ('GD') | dist_ed = 0 and iped_stat NOT IN ('FD','OD','ND','GD') |
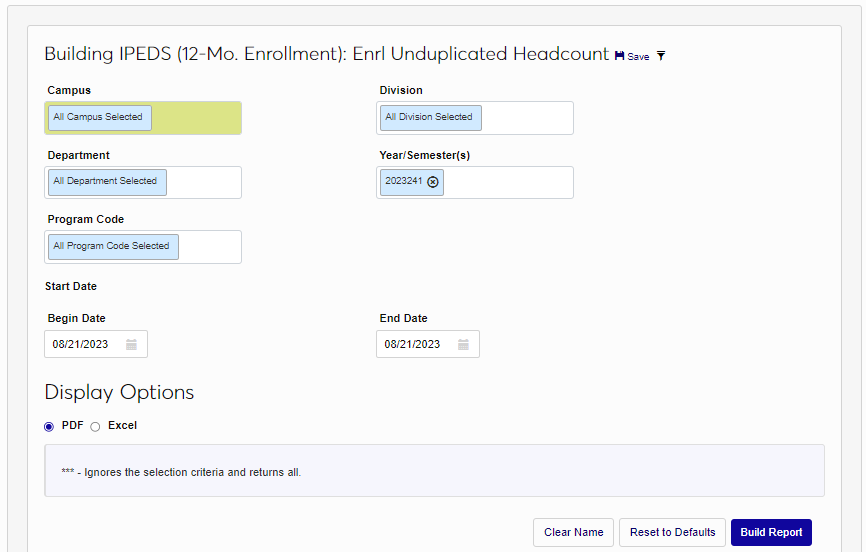
To populate the report, begin by selecting the Campus or campuses to view distance learning enrollment for. By default, all dropdown menus have all options selected. Select the Division(s) that offer distance learning courses.

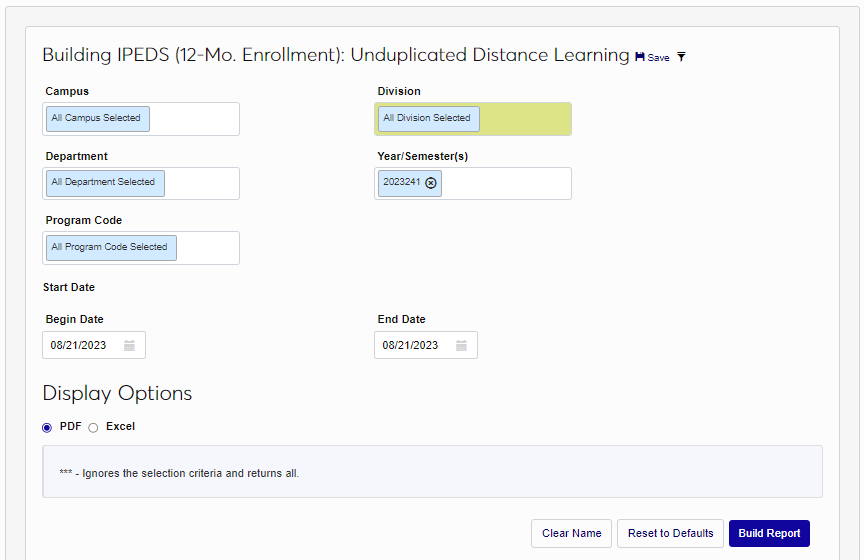
Select the Department(s) that offer distance learning courses. Select the School Year/Semester(s) .
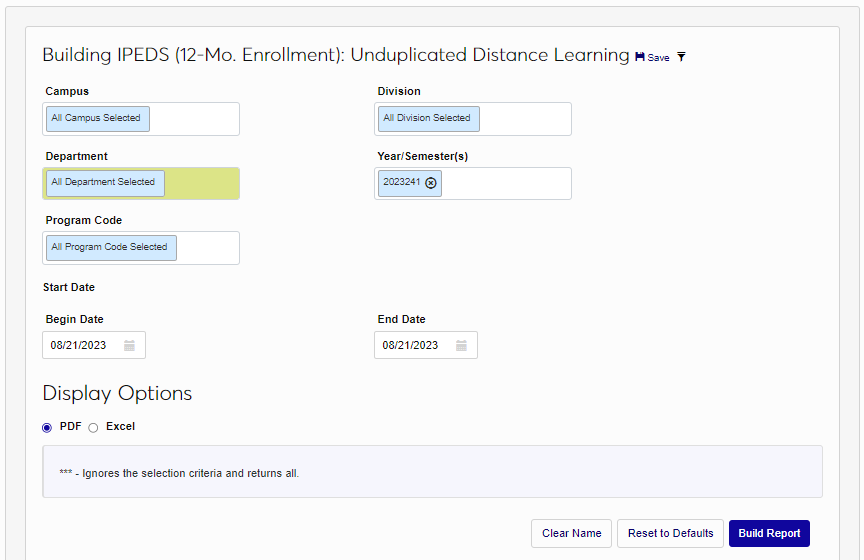
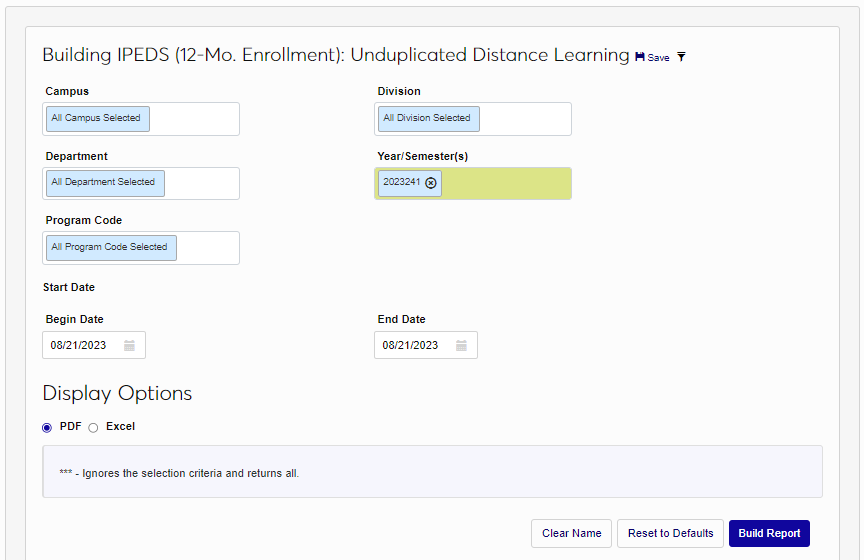
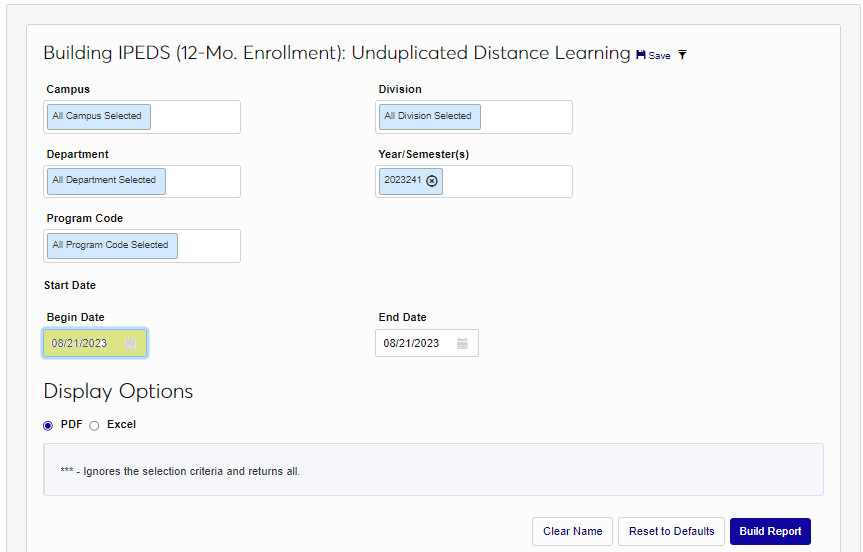
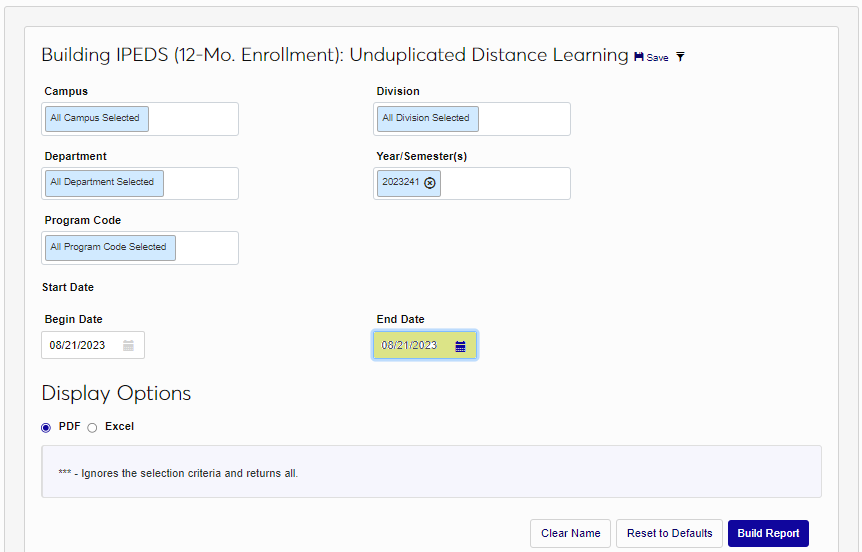
Select the Program(s) that offer distance learning courses. Begin and End dates must be entered to select a specific set of course Start Date(s) . Course start dates are used to accommodate those schools that offer broad, outside of the chosen term/year, registration and enrollment dates. The Begin Date field automatically populates with first date of the chosen term. The End Date must be entered or selected from the calendar.
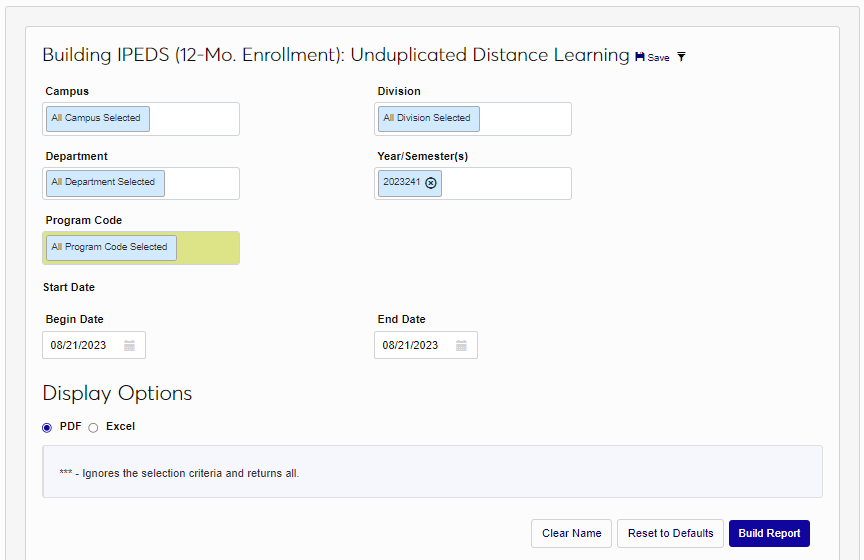
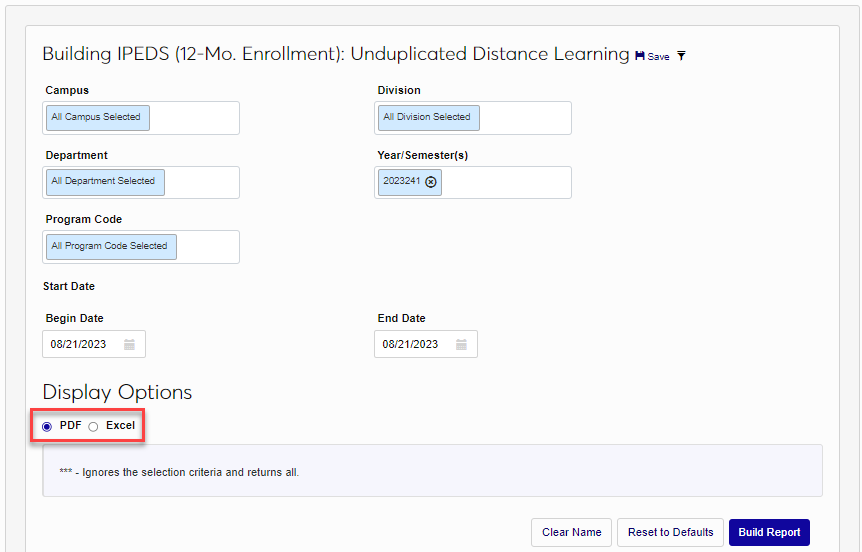
Choose whether the resulting report should display in PDF or Excel. When PDF is selected, a summary page will display with a drill-down to the students in each category. Excel will only provide the drill-down. In this example, PDF is selected but both report types are displayed below. Click Build Report to compile the report with the selected filters and criteria.

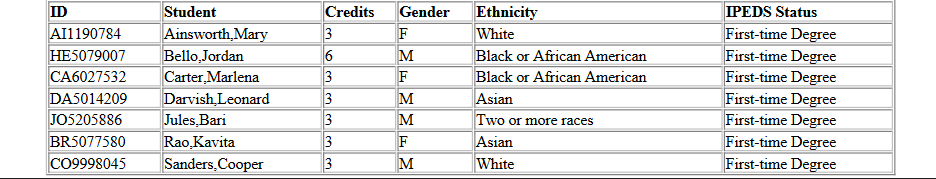
When the report opens in Excel, it displays the ID, Student, Credits, Gender, Ethnicity, IPEDS Status, and Yes or No for Distance Learning as exist in SONIS for the students who meet the criteria.
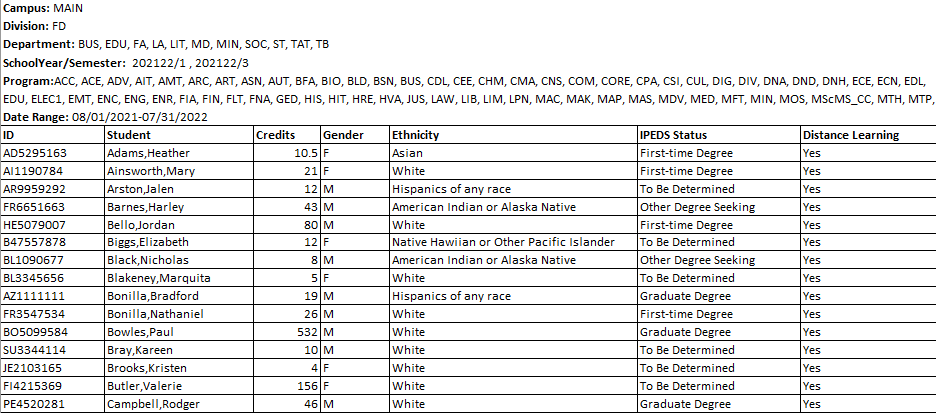
When the report opens in PDF, a summary page displays. For each student type in a category, the summary number can be clicked and the details of the students that make up the summary will display. For each student, the ID, Student, Credits, Gender, Ethnicity, IPEDS Status, and Yes or No for Distance Learning as exist in SONIS are provided.
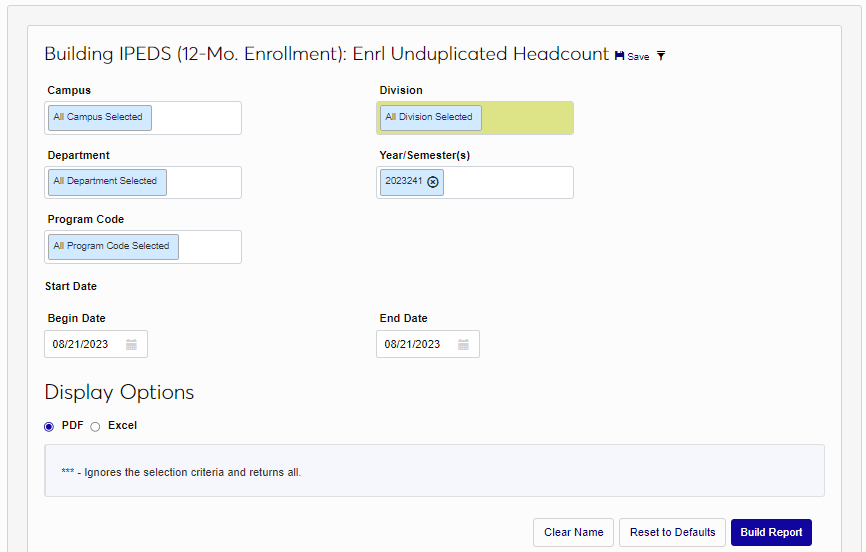
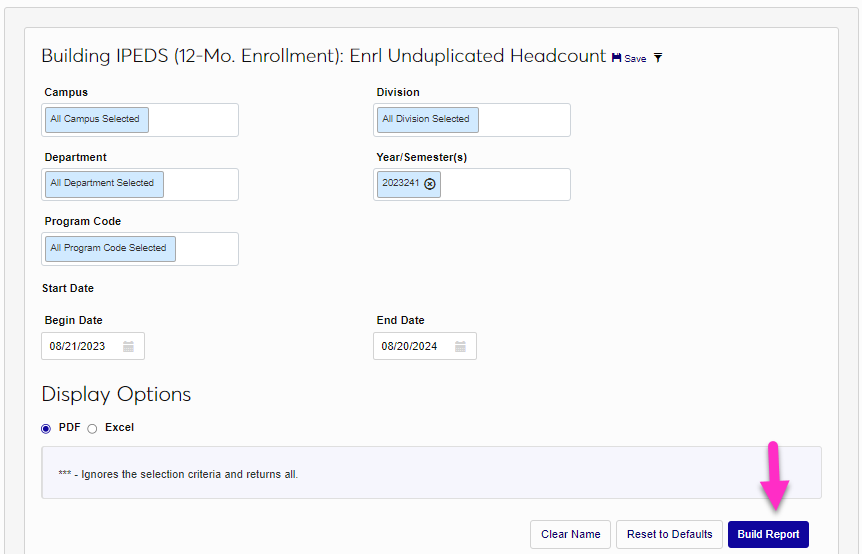
IPEDS 12-Month Enrollment: Unduplicated Headcount
The IPEDS (12-Mo. Enrollment): Unduplicated Headcount report provides reporting information necessary to complete the IPEDs 12-Month Enrollment Survey. The student must have an active Program record for the year being reported. The following data points are used to compile the report:
ID,
Name,
Ethnicity,
Gender,
Total Enrolled Credits,
Campus,
Division,
Department,
Level,
Program,
Cohort,
Citizenship, and
IPED Status.
Note
Inclusion in the report is based on a student's course start date rather than the enrollment date since IPEDS is looking for active students only.
The report can be viewed as PDF or Excel and provides a summary of each category of students with the option to click through to view the students in each category. By default, all dropdown menus have all options selected. To narrow down the population of the report, begin by selecting the Campus or campuses and Division or divisions.
Select the desired Department(s) and the appropriate School Year/Semester(s) .
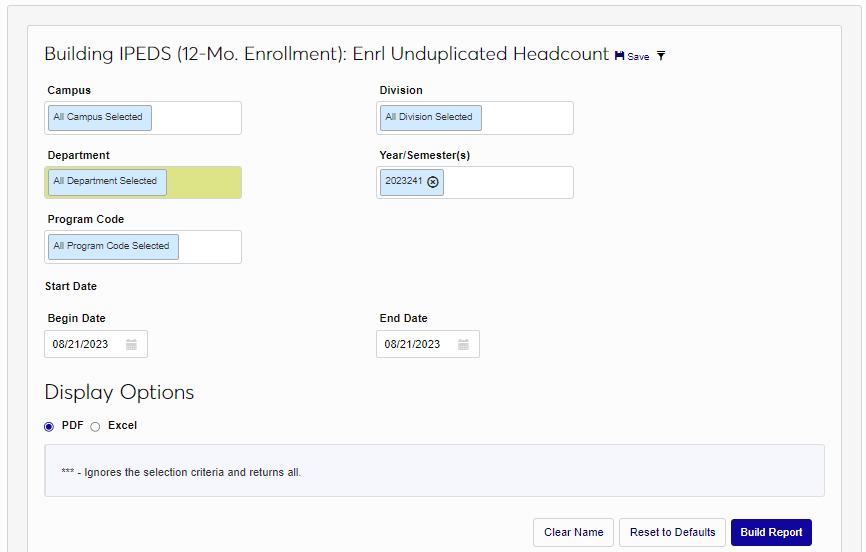
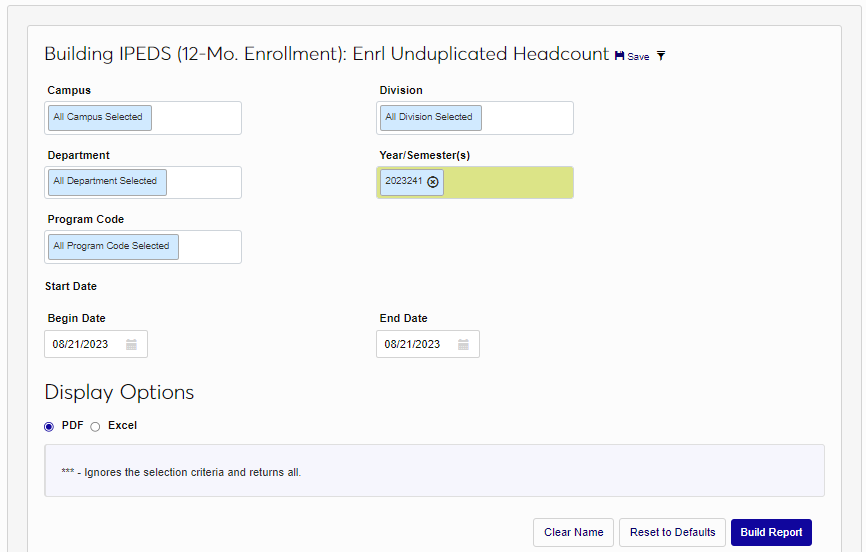
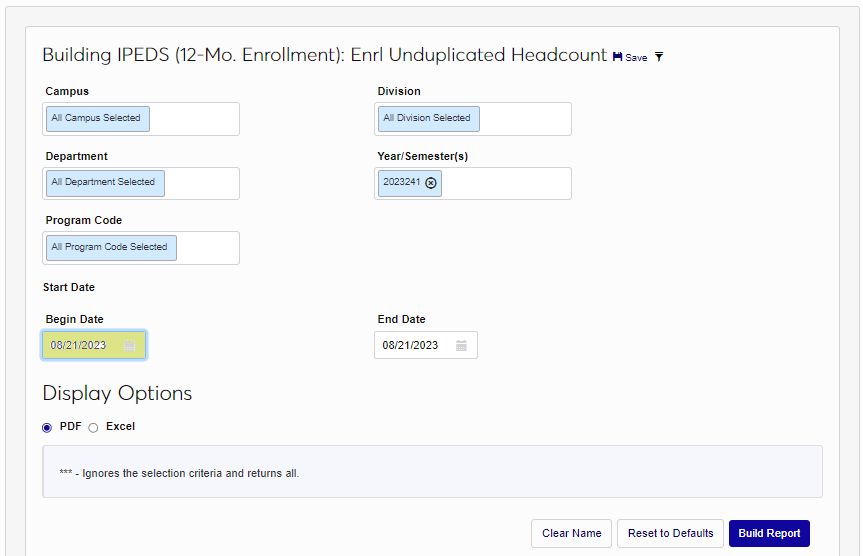
Select the Program Code(s) . If the three asterisks are selected, the criteria selected in other filters will be ignored and simply return all.
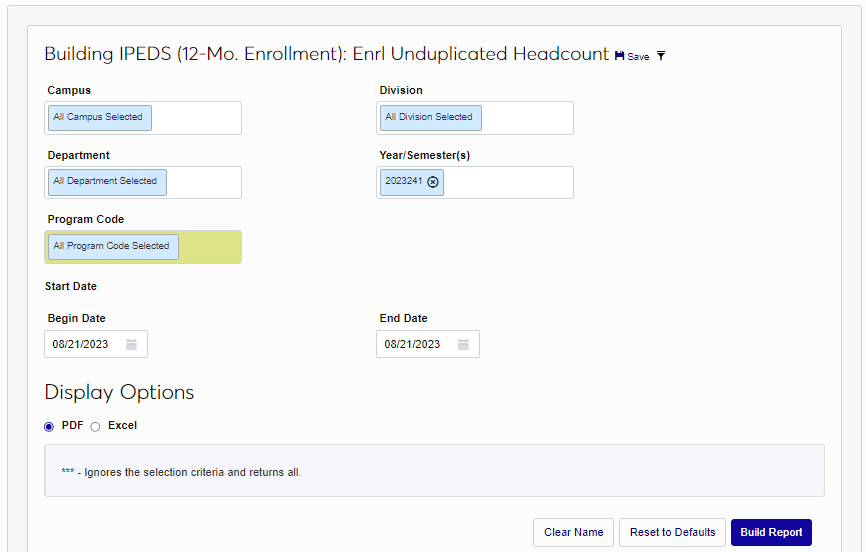
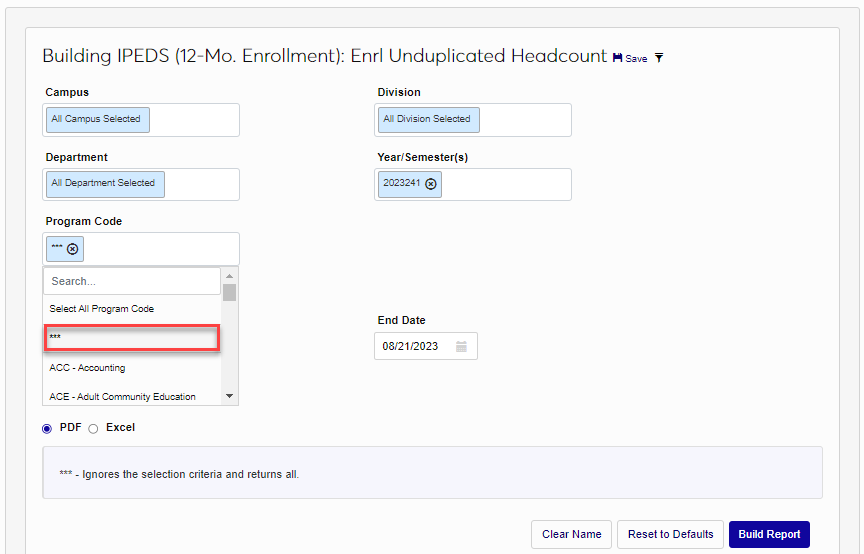
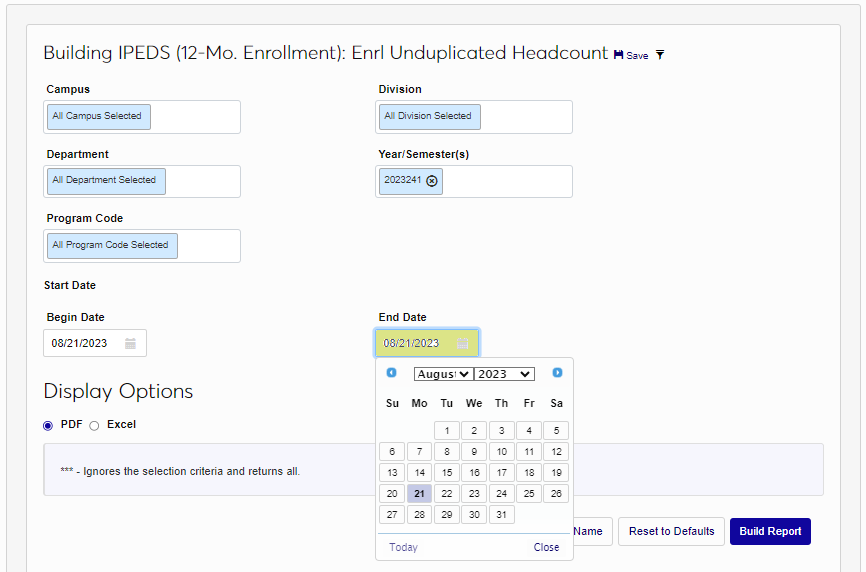
Begin and End dates must be entered to select a specific set of Start Date(s) . The Begin Date will automatically fill with first day of the term. The End date can be changed by clicking in the box and typing the desired date or by selecting it from the calendar. Choose whether the resulting report should be displayed in PDF or Excel. When PDF is selected, a summary page will display with a drill-down to the students in each category. Excel will not provide a summary page, but also has drill-down results. In this example, Excel is selected.
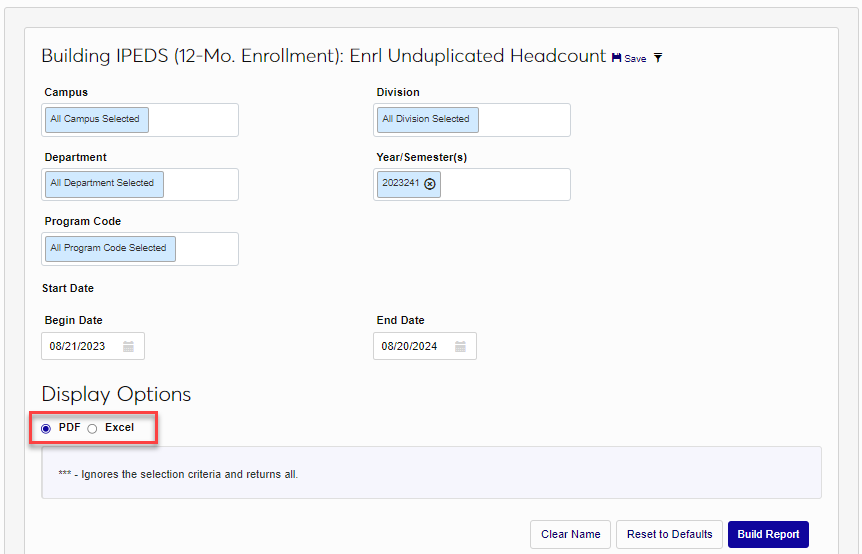
Click Build Report to compile the report with the selected filters and criteria. Select Preview Report to continue to viewing. When the report opens, the Last Name, First Name, Middle Initial, SONIS ID, Ethnicity, Gender, Credits, Campus, Division, Department, Level, Program, IPED Status, Cohort, and Citizenship display for the students who meet the selected criteria.
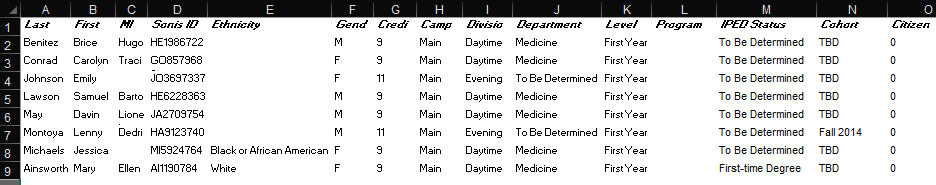
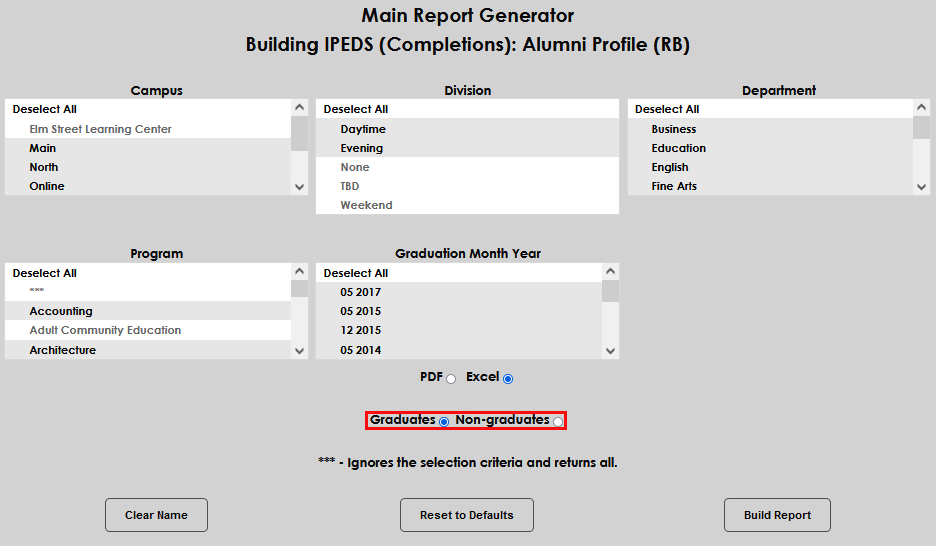
IPEDS (Completions): Alumni Profile
The IPEDS (Completions): Alumni Profile (RB) report supports the IPEDS Completions Survey which requests data on program completion rates for students. The student's active Home Institution Record must have the following data points appropriately populated for the student to be selected in this report.
Graduation Month entered with the two-digit MM format,
Graduation Year entered with the four-digit YYYY format,
Graduation Date must be entered,
Graduated indicator must be checked, and
Degree must be selected and mapped correctly to a degree ranking.
Additionally, the student's active Program Record must have CIP Code. The report can be viewed as PDF or Excel and the PDF provides a summary of each category of students with the option to click through to view the students in each category. By default, all dropdown menus have all options selected. The data compiled and returned for each student are:
Class,
ID,
Name,
Street,
City,
Zip,
State,
Date of Birth,
Entry Date,
Phone,
Gender,
Graduation Date,
Ethnicity,
Citizenship,
Degree,
Degree Rank,
Program Code,
Age at Graduation,
Program Start Date,
Program Stop Date,
Graduated, and
IPED Status.
To select the population of the report, begin by selecting the Campus or campuses and Division(s).
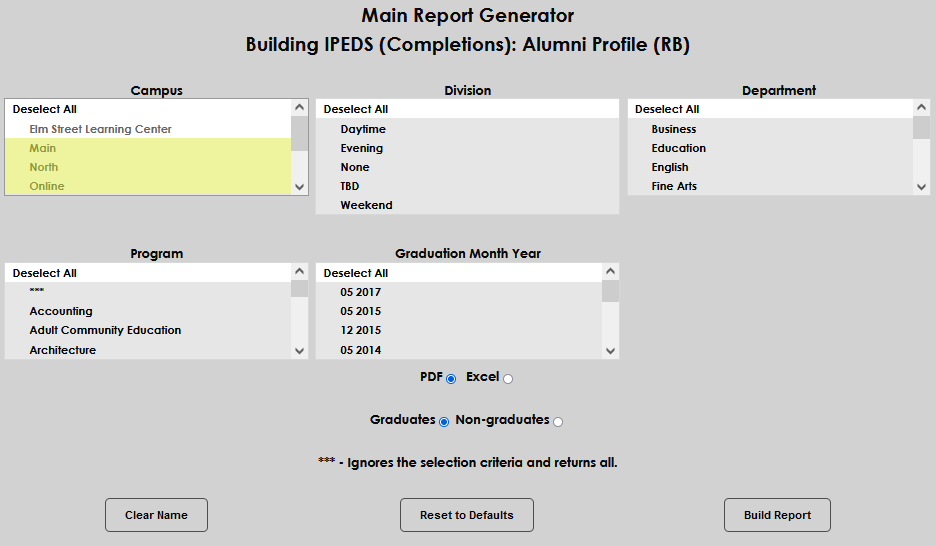
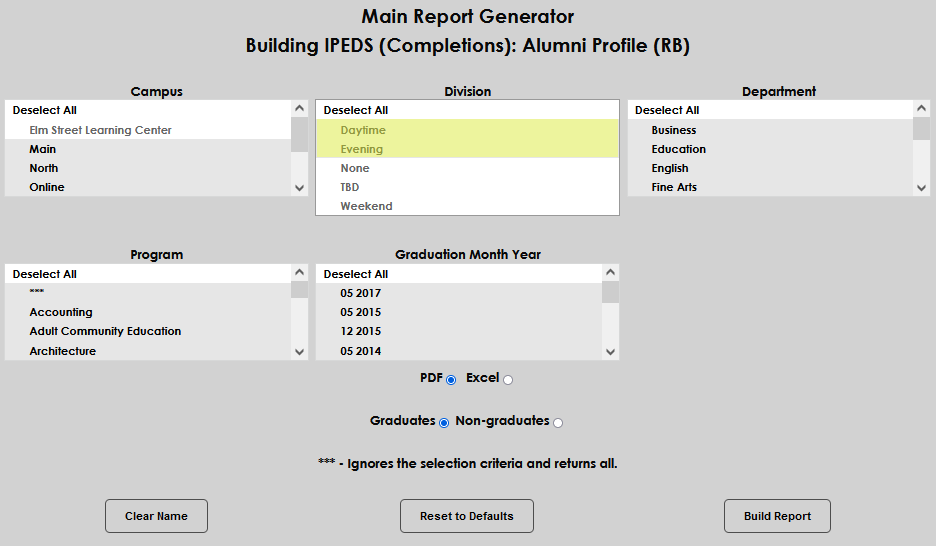
Select the desired Department(s) and the appropriate Program(s) . If the three asterisks are selected, the criteria selected in other filters will be ignored and simply return all.
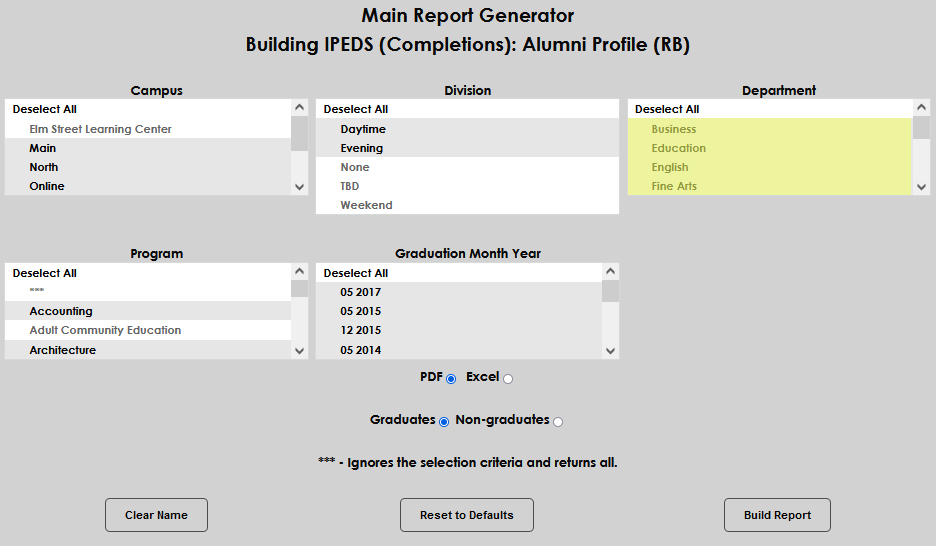
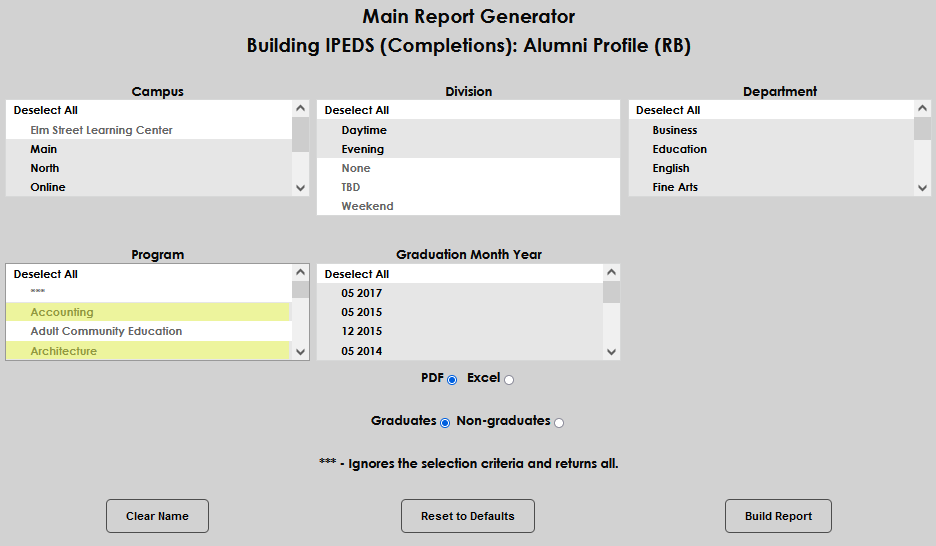
Select Graduation Month and Year(s) for the alumni being selected. Select the appropriate radio button to determine whether the report should be displayed in PDF or Excel. When PDF is selected, a summary page will display with a drill-down to the students in each category. Excel will simply display the results. In this example, Excel is selected.
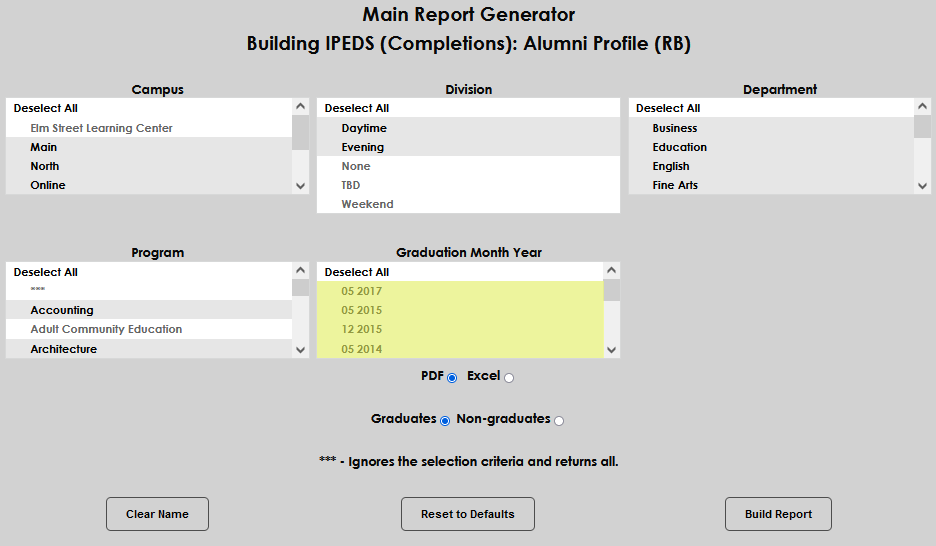
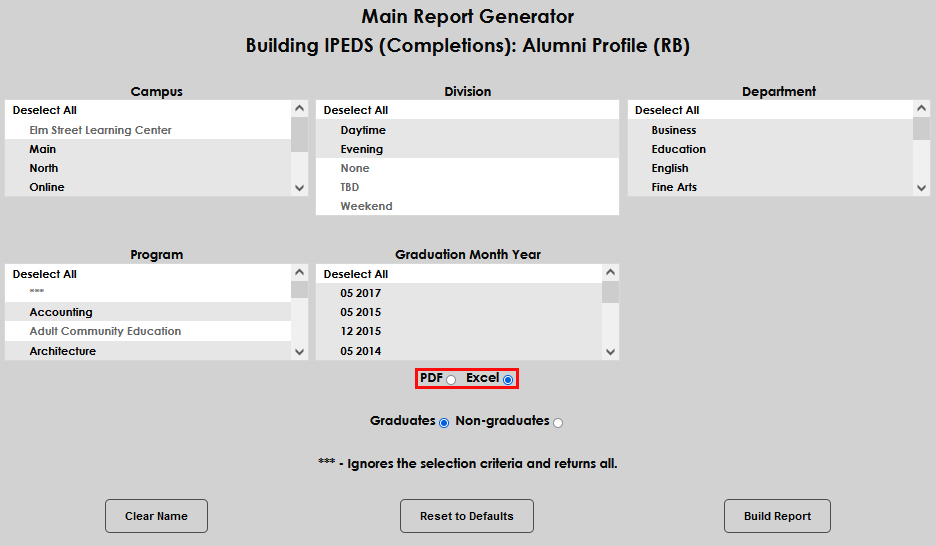
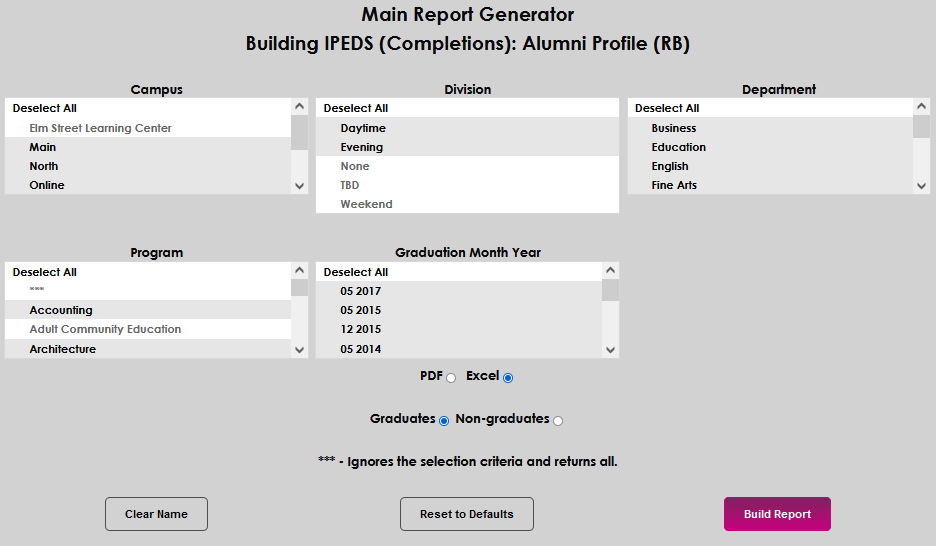
Select the Graduates or Non-graduates radio button, as appropriate to the criteria selected above. Click Build Report to compile the report with the selected filters and criteria. Select Preview Report to continue viewing.
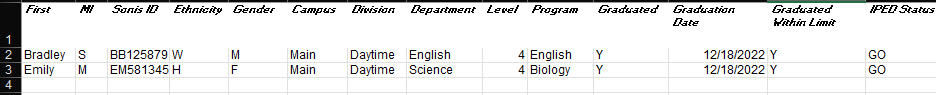
When the report opens, the Last Name, First Name, Middle Initial, SONIS ID, Ethnicity, Gender, Campus, Division, Department, Level, Program, Graduated, Graduation Date, Graduated Within Limit, and IPED Status display for the students who meet the selected criteria.


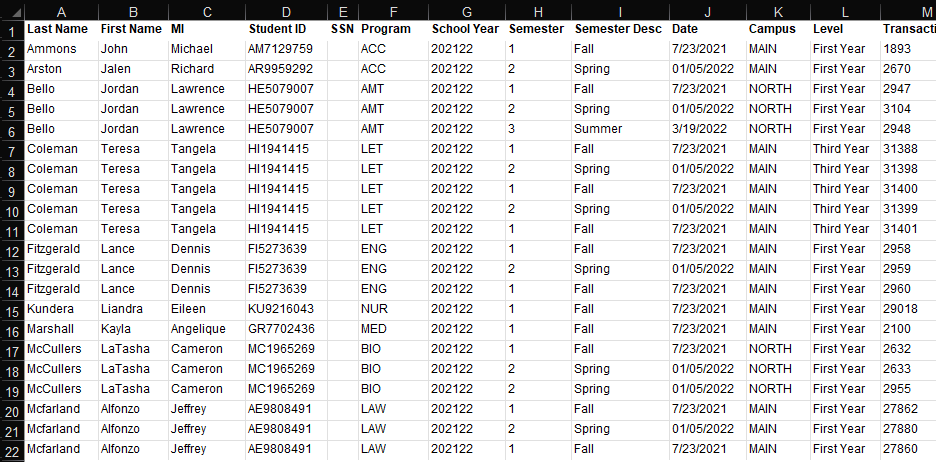
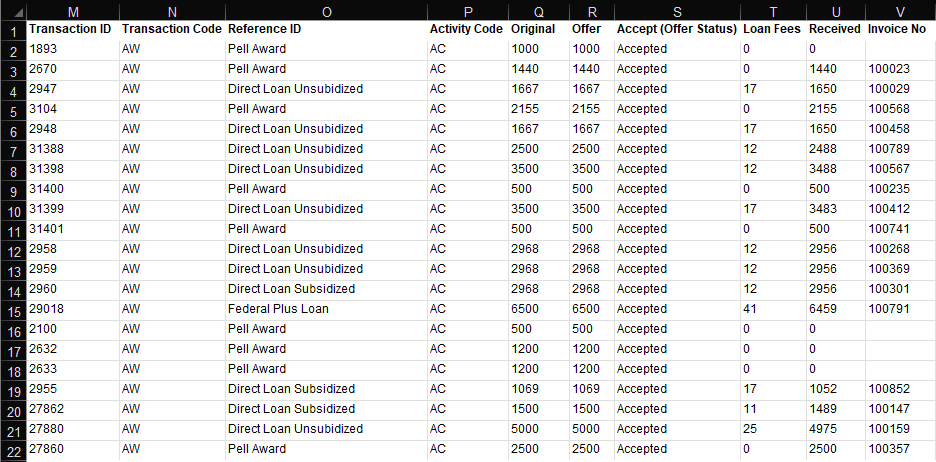
IPEDS Financial Aid Survey/FA Award Detail
The IPEDS Fin. Aid Survey/FA Award Detail report supports the IPEDS Financial Aid Survey which requests data about students who were awarded financial aid. It produces an unduplicated headcount of all financial aid recipients in SONIS for the school year and semester that are selected. The report can be viewed as PDF or Excel. The PDF provides a summary of each category of students with the option to click through to view the student details. The Excel report displays the students and their data. By default, all dropdown menus have all options selected.
Students must have Title IV awards in SONIS to be included, and they must have accepted or declined awards through the SONIS Student Portal OR a SONIS user updated the awards on the student's behalf within the SONIS Administrative portal to be included in the student response section. The data compiled and returned for each student are:
Last Name,
First Name,
Middle Initial,
Student ID,
SSN,
Program,
School Year,
Semester,
Semester Desc,
Date,
Campus,
Level,
Transaction ID,
Transaction Code,
Reference ID,
Activity Code,
Original,
Offer,
Accept (Offer Status),
Loan Fees,
Received,
Invoice No,
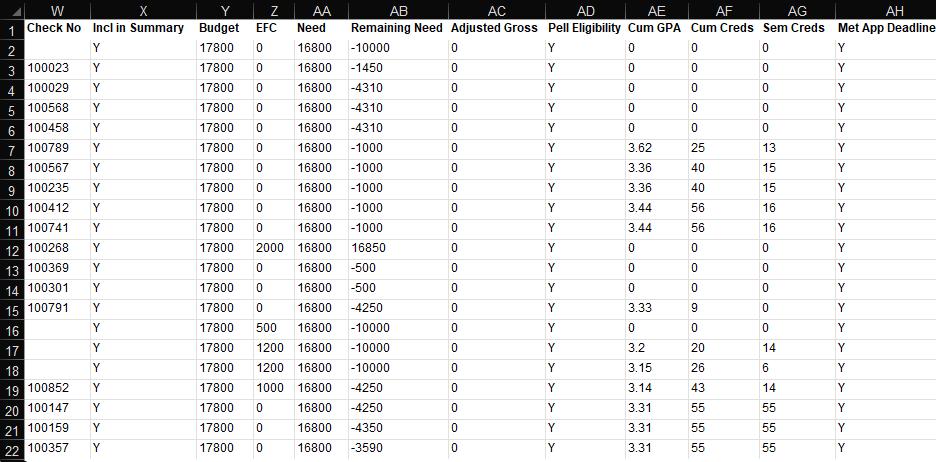
Check No,
Incl in Summary,
Budget,
EFC,
Need,
Remaining Need,
Adjusted Gross,
Pell Eligibility,
Cumulative GPA,
Cumulative Credits,
Semester Credits,
Met Application Deadline,
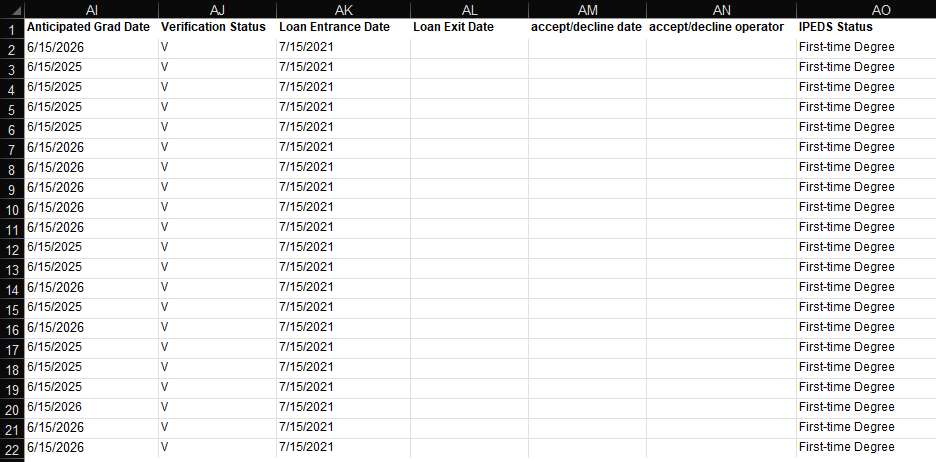
Anticipated Grad Date,
Verification Status,
Loan Entrance Date,
Loan Exit Date,
Accept/Decline Date,
Accept/Decline Operator and
IPED Status.
To select the population of the report, begin by selecting the Campus(es) and Division(s).
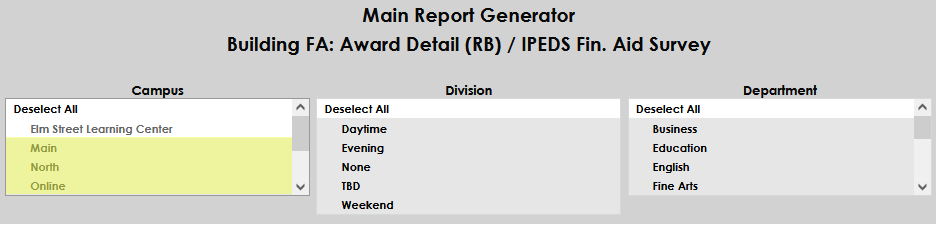
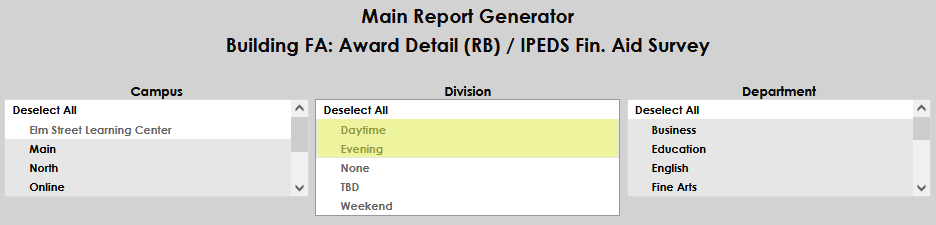
Select the Department(s) and Module Status(es) .
Select the School Year(s) and the Semester(s) associated with the students needed in the report.
The awards that should be reported upon are determined by choosing the appropriate award name(s) in the Select award(s) menu. Select the desired Program(s) . Selecting the three asterisks ( *** ) ignores the selection criteria and returns all.
Select the Level(s) . If desired, a single student can be reported upon by entering the user's ID .
If the Social Security Number(s) should be displayed on the report, click the Display SSN on report box. Select the status of the award(s) to be reported on by clicking the desired radio button. As mentioned above, these options will only work if the user utilizes the SONIS Student portal to respond to the award offer OR a SONIS user updates the awards on the student's behalf within the SONIS Administrative portal. The options will not work if a non-SONIS portal such as JFA or PowerFAIDs was used to respond to the offer unless a user made those updates on the student's behalf in the SONIS Administrative portal as well.
Select the format the report should be displayed in, either PDF or Excel . As with other SONIS reports, the PDF will provide a summary screen with click throughs to the details of the data and Excel will display the data without summary. In this example, Excel is chosen. Click Build Report to execute the query.
Select Preview Report to continue to the report results. When the report opens in Excel, the data is displayed as shown below.


IPEDs Graduation Rates
The IPEDS: Graduation Rates report supports the IPEDS Graduation Rates Survey which requests data on program graduation rates for students who graduate within 200% of the prescribed program length. Additionally, SONIS provides a filter allowing selection of students who graduated at 150% of the program's length. Please note that the determination for graduating within 150% or 200% of the program length is done by counting the number of months between the student's program start and end dates where the program graduation indicator is true and comparing that value to the Program Length in Months as shown on the corresponding Programs page in Systems hub. The report can be viewed as PDF or Excel and the PDF provides a summary of each category of students with the option to click through to view the students in each category. By default, all dropdown menus have all options selected. The data compiled and returned for each student are:
ID,
Name,
Ethnicity,
Gender,
Total Enrolled Credits,
Campus,
Division,
Department,
Level,
Program,
Graduated,
Graduation Date,
Graduated Within Limits, and
IPED Status.
To select the population of the report, begin by selecting the Campus or campuses and Division or divisions.
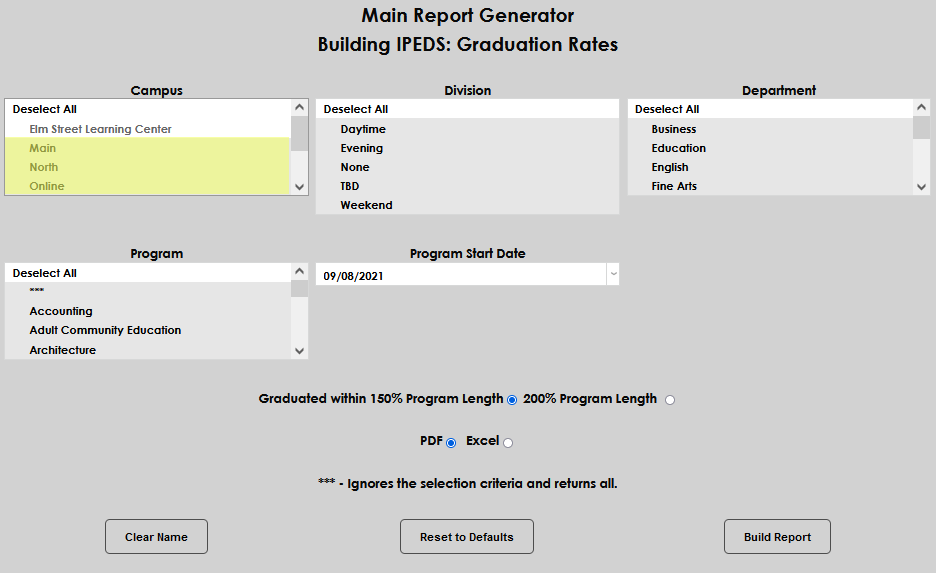
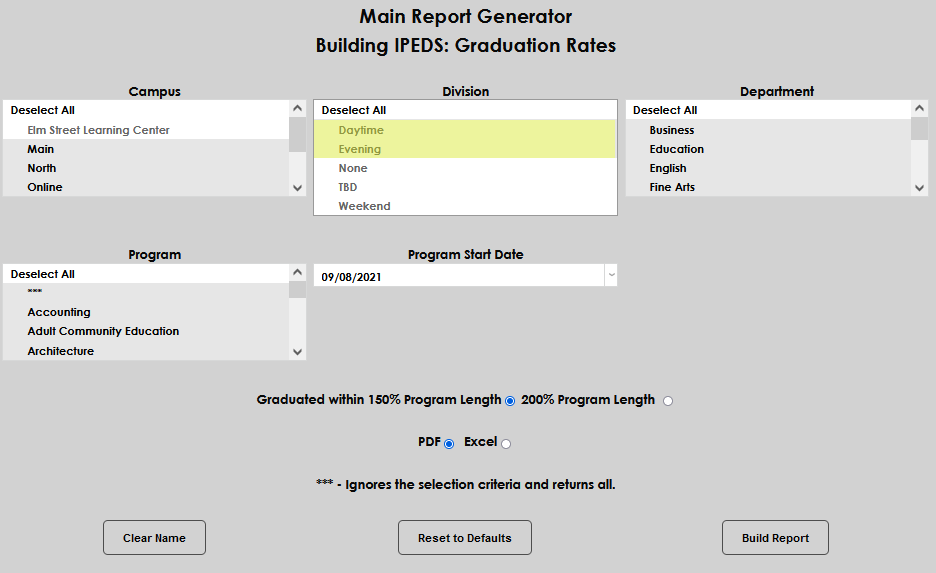
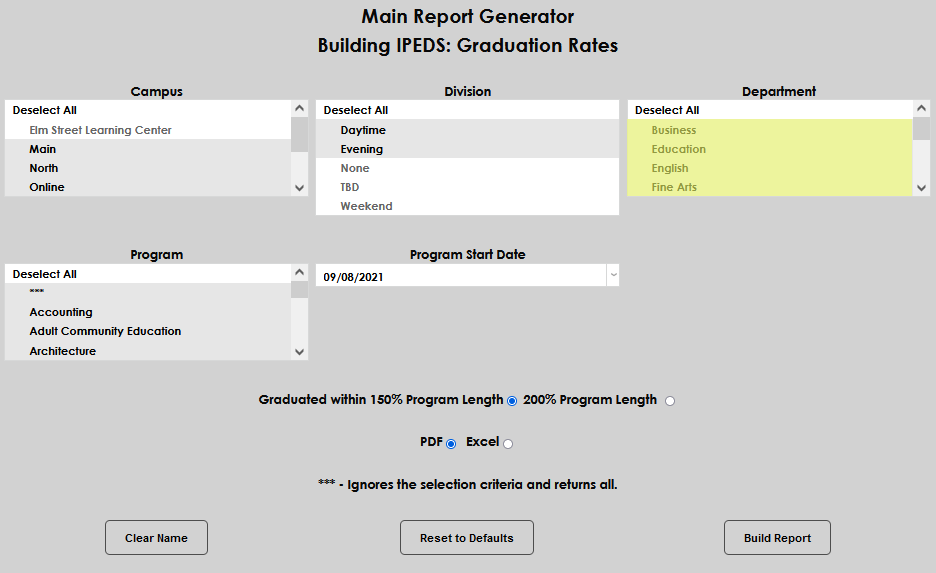
Select the desired Department(s) and the appropriate Program(s) . If the three asterisks are selected, the criteria selected in other filters will be ignored and simply return all.
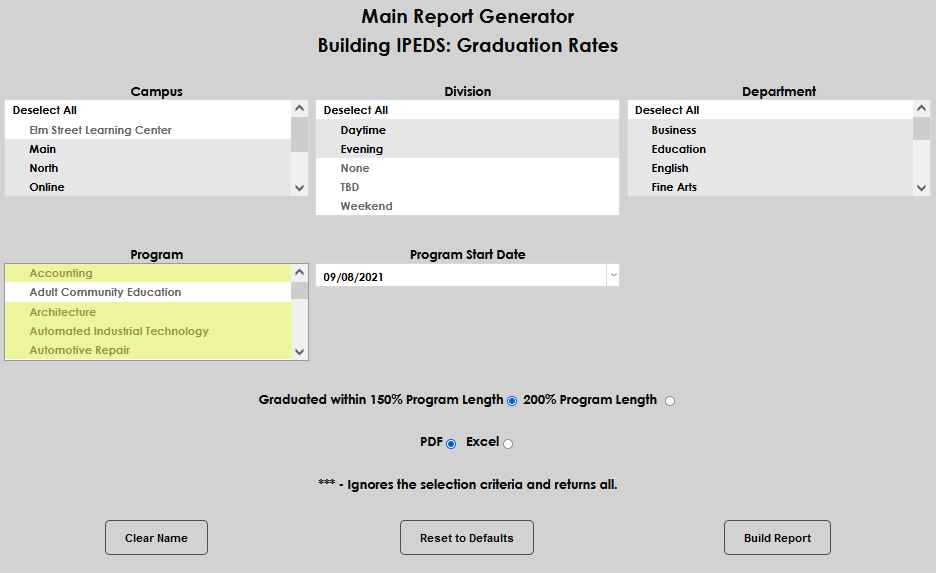
Enter the earliest possible Program Start Date for the graduates being selected. Select the appropriate radio button to determine whether students who graduated within 200% or 150% of the program length should be returned.
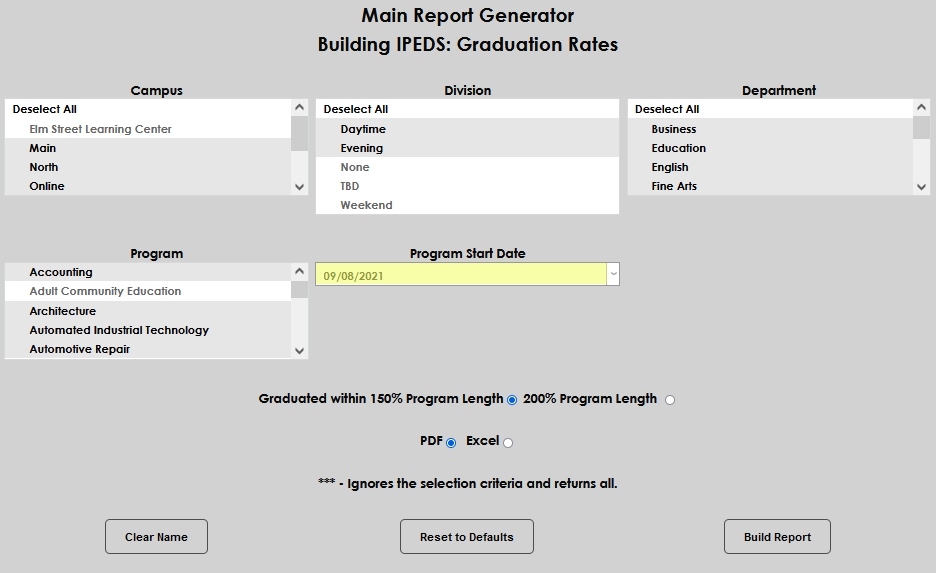
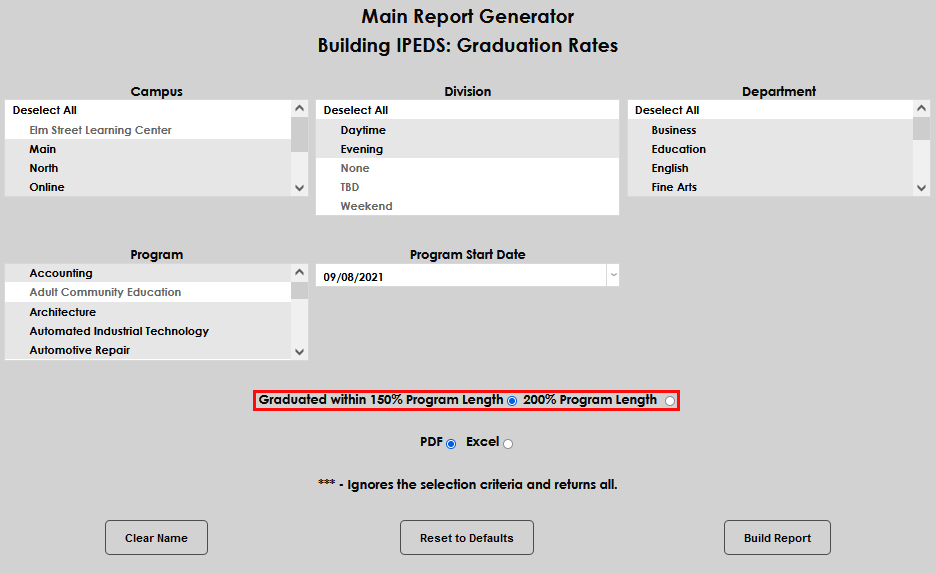
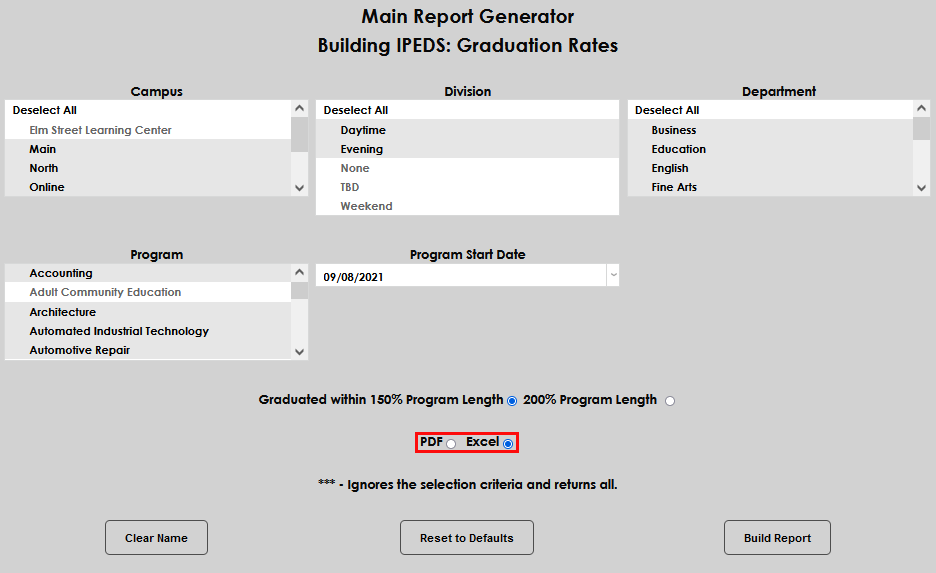
Choose whether the resulting report should be displayed in PDF or Excel. When PDF is selected, a summary page will display with a drill-down to the students in each category. Excel will simply display the results. In this example, Excel is selected. Click Build Report to compile the report with the selected filters and criteria. Select Preview Report to continue viewing.
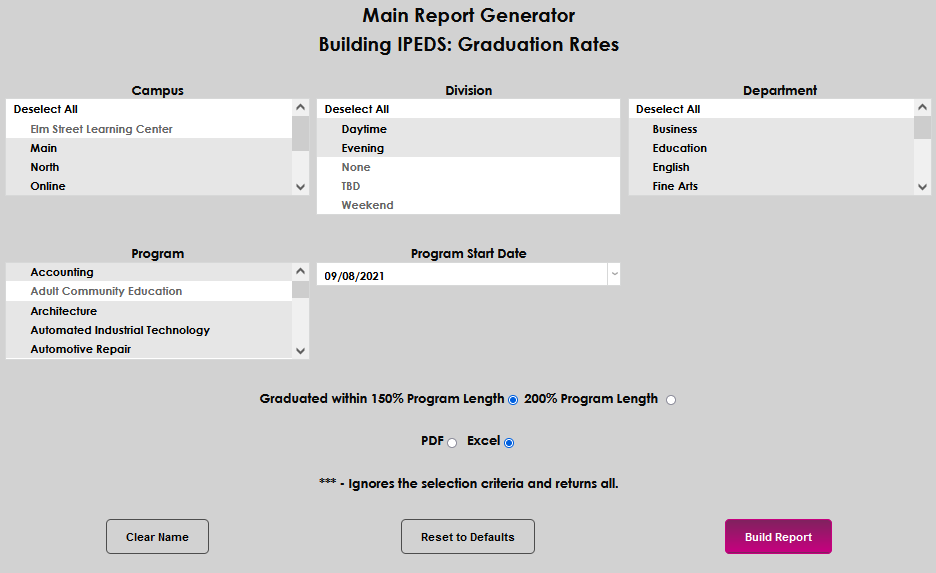
When the report opens, the Last Name, First Name, Middle Initial, SONIS ID, Ethnicity, Gender, Campus, Division, Department, Level, Program, Graduated, Graduation Date, Graduated Within Limit, and IPED Status display for the students who meet the selected criteria.
Miscellaneous "I" Reports
Institution Events
Interests
Interests/Activities Semester Grade Summary
Izenda Reports
Miscellaneous "J" Reports
Jobs
Lists
Lists Report
Lists: Advisors
Lists: Holds
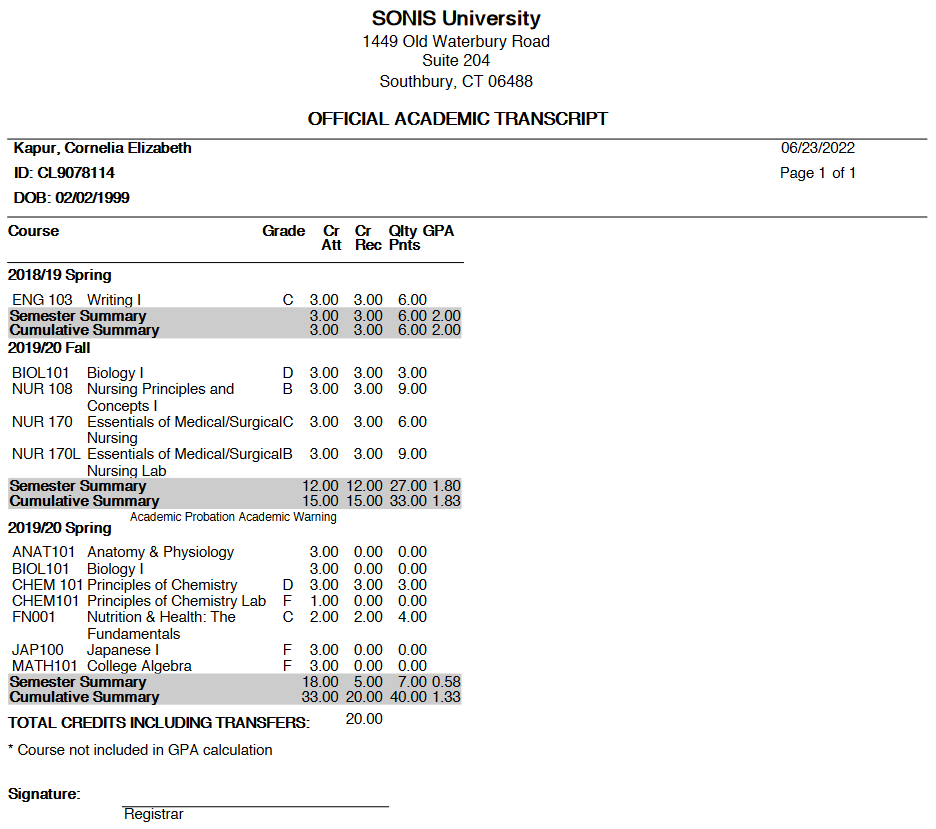
Lists: Transcripts
Loans
Loan Entrance and Exit
Loans: Days Delinquent
Loans: Default Calculator
Loans: Default Summary
Loans: Delinquent Borrowers
Loans: Repayment Tracking
Loans: Student Status
Miscellaneous "L" Reports
LDA Program Division
Licenses and Certifications
LOA Report
Mail Merge
Mail Merge Students/Applicants
Mailing Labels
Mailing Labels For Prospects
Meetings
Meetings - Admissions
Meetings by Day
Meetings by Staff
Miscellaneous "M" Reports
Marital Status
Marketing Efficiency
Ministerial Credentials
Ministerial Standing
Miscellaneous "N" Reports
Notes By Note Type
Online Applications
Online Application: Deleted
Online Application: Imported
Online Application: In Progress
Miscellaneous "O" Reports
Operator Transactions Summary (CFM)
Order Tracking
The Reports menu utility, Order Tracking, provides Jenzabar SONIS member institutions who categorize student and student-related actions such as leave status, satisfactory academic progress status, application for graduation, and program or advisor change requests as orders, to monitor the number and status of these activities. Filters for campus, division, department, module status, and level are provided. See Order Tracking for more details.
Payment Plans
Payment Plan Career Majors
Payment Plan Due Dates
Payment Plan Due Dates by Year/Sem
PayPal
PayPal DE Transactions
PayPal Transactions
Progress
Progress Admin Detail
Progress Admin Summary
Progress Student Detail
Pro Bono
Pro Bono Required Hours Completed
Pro Bono Work
Prospects
Prospect Call List
Prospect Inquiry Extra
Prospect Summary: Referral Type by Campus
Prospect Summary: Referral Type by Campus and Term
Prospect Summary: Referral Type by Term and Recruiter
Prospective Students
Prospects by Refer By
Prospects by Type
Miscellaneous "P" Reports
Parking Incidents
Photo Directory
Plan of Study
Profile Details
Miscellaneous "Q" Reports
Query Builder Reports
Miscellaneous "R" Reports
90/10 Revenue Report
For-profit schools that administer Title IV funds must demonstrate annually that no more than 90% of the institution's revenue is from Title IV Federal Student Aid program funding. This report can be used to facilitate that reporting. The member institution is responsible for formatting the resulting data for submission to the requesting agency. Transaction Codes and Adjustment Codes must be correctly set up as required by the requesting agency. Each Transaction Code must have a T-Code Revenue Mapping Category associated with it to indicate whether it is an Agency Payment, Federal Agency Payment, Subsidized Loan, Unsubsidized Loan, PLUS Loan, Pell Grant, SEOG, student payment, and/or cash payment. The mapping codes are used to calculate the amounts displayed in each column of the report. For example, the T-codes for Unsubsidized Loans and Unsubsidized Loan Refunds can be mapped to the Unsubsidized T-code Category on the T-Codes Revenue Mapping page. The Unsubsidized column on the report will then include a sum of all transactions with those T-codes for the student that fall within the selected parameters.
To create the report, select Revenue Report from the Reports menu. By default, all values in each filter are selected. To select fewer values within a filter, simply click Deselect All and click on the desired value(s).
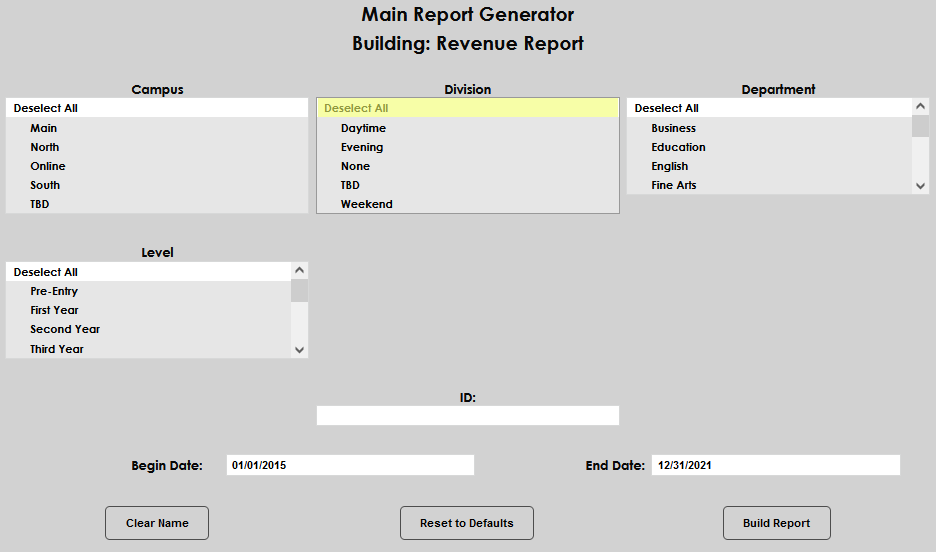
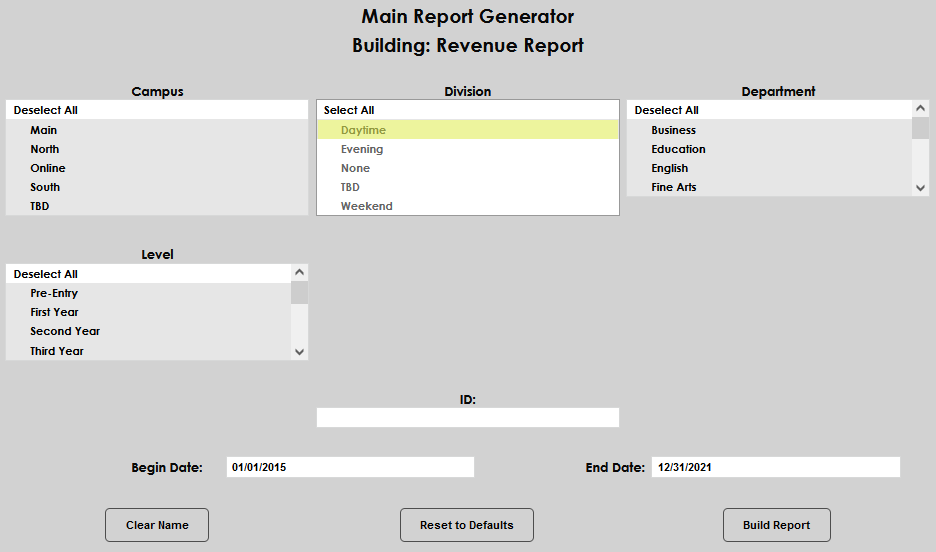
The report can be created for a single user by entering the user's ID in the ID: field. Enter a Begin Date and End Date to define the date range for the results.
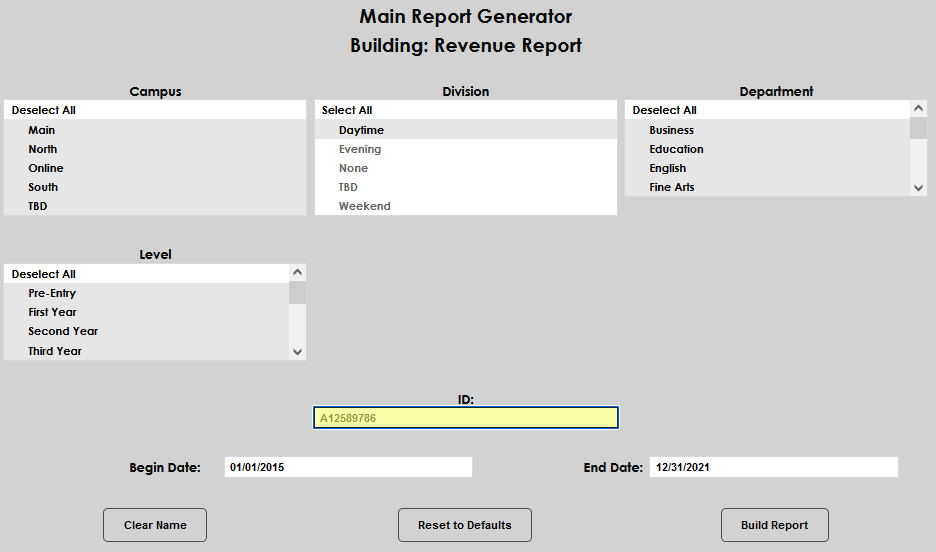
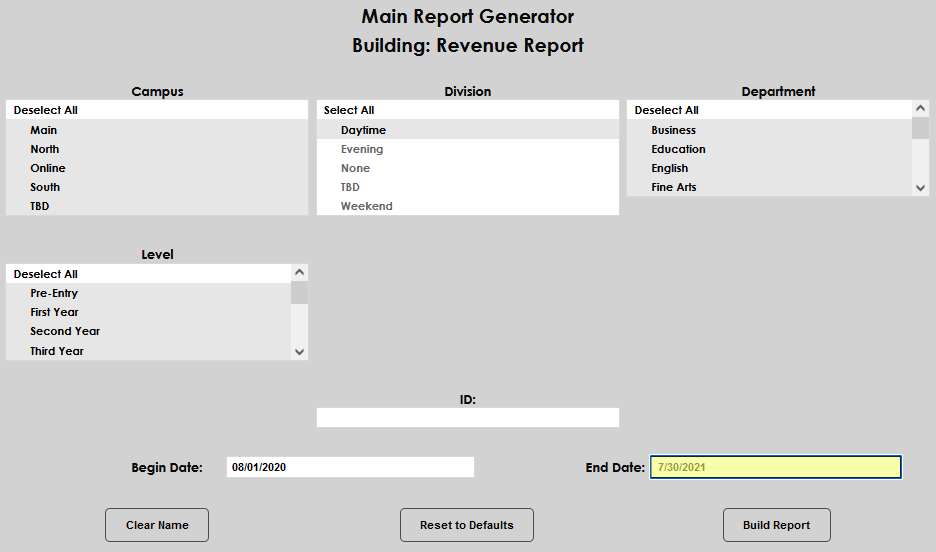
Click Build Report to compile the report. Click Preview Report to view the compiled report.
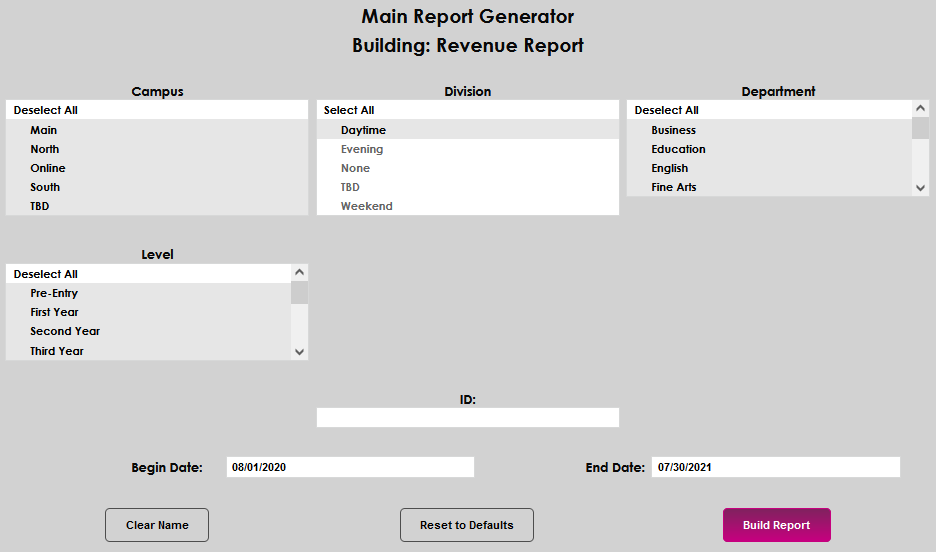

The report displays in Excel and is formatted as a .csv.
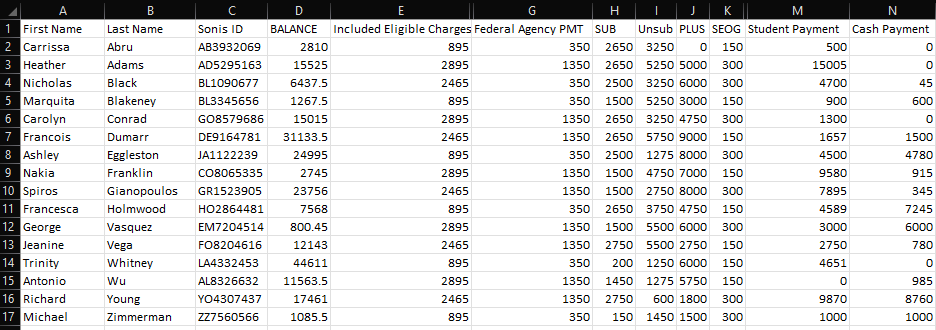
Repeated Courses
Retention Report
Schedules
Schedule: Instructor
Schedule: Room
Schedule: Student
Student Data
Student Attendance/Progress
Student Booklists
Student Book Order Request
The Student Book Order Request report is a list of books that have been requested by students through the Books page of the Student portal. When the feature is active, students can request books and cancel those requests. You can use this report to fulfill the book order requests. The report lists the book, the ISBN, the author, the edition, and whether the book is required or not. It also lists the student's SONIS ID and name along with the course, the course description, and the program.
The report can be displayed as a PDF or downloaded as an Excel file.
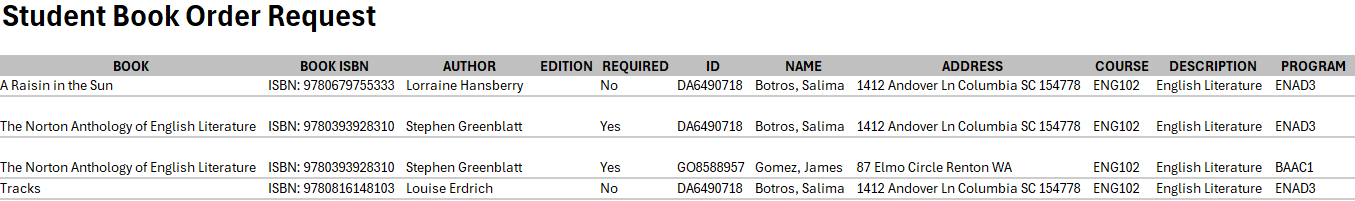
Student Courses
Student Intake Information
Student Ledger
Student Profile
Student Schedule Changes
Miscellaneous "S" Reports
Semester Academic Status
The Semester Academic Status Report provides a list of students with a particular academic status that can be used to create activities or contact the student directly. The report can be filtered by Campus, Division, Department, School Year, Semester, Program, and/or Level. An Honors/Probation status must also be selected. This list is based on the Honors/Probation table and Honors/Probation Requirements and Assignments are used to build the report.
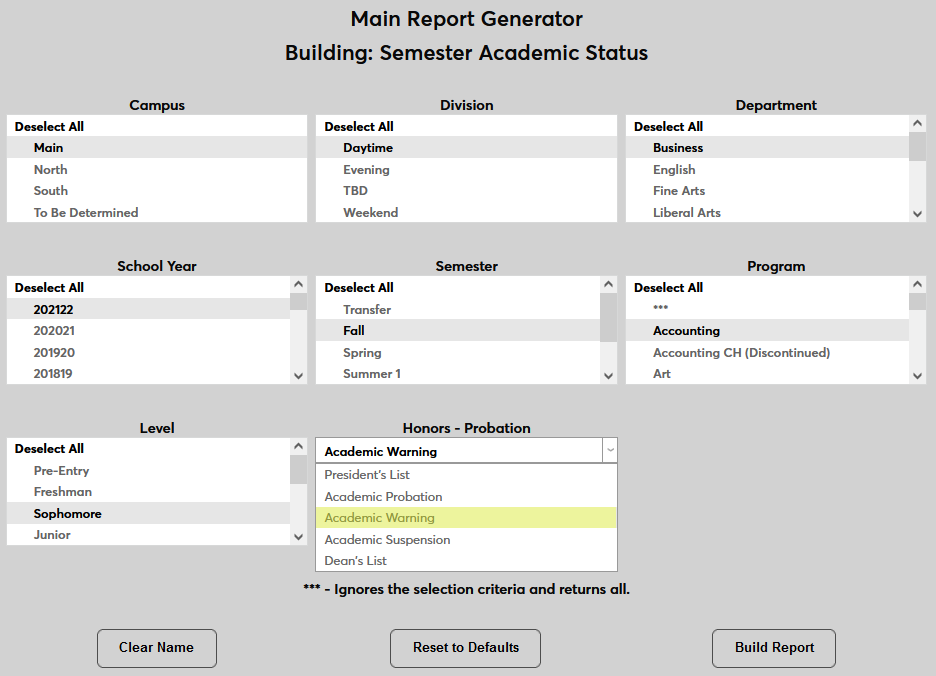
Once the report has been built, click on a student's name to open the default email client and send the student an email.
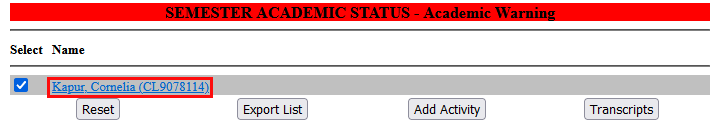
Another option is to create an activity by selecting one or more students and clicking the Add Activity button.
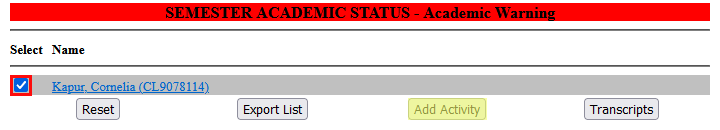
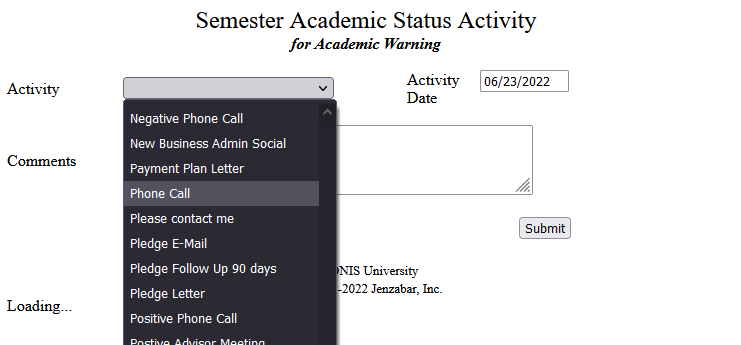
Student transcripts can also be viewed from this report by selecting a student or students and clicking the Transcripts button.