Reporting
This chapter describes data you can display using the JICS Reporting Services reports and the Reporting feature.
If you are looking for details on how to set up the Reporting Services reports, refer to the Usage Statistics Logging section. This chapter solely details the information provided by the reports.
In this chapter:
Key Concepts
The Reporting feature is a very simple feature that provides the following:
A few quick statistics about your portal
A link to the JICS Reporting Services reports
In order to view any of this data, you must have activated usage statistics logging and imported the JICS reports into Reporting Services. These processes are described in the Usage Statistics Logging section.
The only configuration that you need to do for the Reporting feature is to configure the URL it displays. That is also described in Configuring the URL Used by the Reporting Feature section.
Before reviewing the descriptions of the actual reports (in the Available Reports section), you may want to review the following terms, which are used in the reports.
Term | Description |
|---|---|
user session | A user session starts when a browser accesses the site. The session lasts until the last traceable activity finishes. |
page load | Page load starts when a page is requested and lasts until it is actually rendered. |
feature usage | Feature usage occurs when a user interacts with the maximized view of a feature (as opposed to the smaller default view). |
active user | An active user is one who has logged in to the system at least once in the past two weeks. |
portlet | A type of feature—such as Blog—not a specific feature instance. |
Data Displayed in the Feature
The Reporting feature, in both the default view and the maximized view, shows the following information:
Users in System – the number of JICS user accounts that exist.
Users Online Now – the number of active login sessions. Note that this number does not necessarily represent unique users. For example, a user logged in twice—once in Firefox and once in Chrome—would be counted twice.
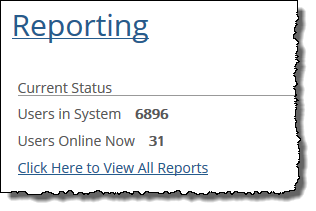 |
If users need more information, they can click the link labeled Click Here to View All Reports. Clicking this link opens a new browser window or tab, pointing to a URL that is defined on the Site Manager > Framework settings > Location screen. This URL should point to the Report Manager virtual directory—in other words, a screen that lets users view report data. Note that users will have to authenticate before being allowed to view the reports.
If issues exist with the Click Here to View All Reports URL, refer to the Configuring the URL Used by the Reporting Feature section.
If issues exist with a JICS user attempting to authenticate, make sure that a Reports Users group was created on the server hosting Reporting Services and that all JICS users who need access have been added to the group. For more details, refer to the Managing Permissions in the Usage Statistics feature section.
About the Reports
This section describes the JICS reports that were created for use with Reporting Services. Note that these reports can be viewed without the use of the Reporting feature, but since we expect the Reporting feature will often be used to point to them, they are described here.
Jenzabar provides eight reports for use with Reporting Services. These are described below.
This report features a graph showing the average number of page loads per user session for each month of a given year. When you open the report, it shows the breakdown for the current year, but you can use the form at the top of the screen to specify a different year, if desired.
At the right, a table shows this same data, along with the average for the year.
Note that in the Site Stats folder, this report is listed as Average Pages Per View – Year View. The correct name, Average Pages Per Session – Year View, is on the screen when the report displays.
With this report, a graph shows the average time of a user sessions (measured in minutes). When you open the report, it shows the breakdown for the current year, but you can use the form at the top of the screen to specify a different year, if desired.
At the right, a table shows this same data, along with the average for the year.
With this report, a bar graph displays the total number of user sessions per month. Below the bar graph, the report provides data for each day where data exists, including the following:
The average number of user sessions per hour and the total for the day
The average number of page loads per hour and the total for the day
The average number of unique visitors per hour and the total for the day
The average number of page loads per user session
The average time of each user session in minutes
Additionally, the last row in the table includes summary data representing the entire month.
This report describes overall usage for each year that you have logged usage statistics. Specifically, a bar graph describes the total number of user sessions for each year. Below the bar graph, a table shows the following data for each year:
The average number of user sessions per day and the total for the year
The average number of page loads per day and the total for the year
The average number of unique visitors per day and the total for the year
The average number of page loads per user session
The average duration of each user session in minutes
Additionally, the last row in the table includes summary data representing the entire reporting period.
If appropriate, you can click on any year to view a report on that year only (the Overall Site Usage – Year View report).
With this report, a bar graph displays the total number of user sessions per month. Below the bar graph, a table provides the following data for each month:
The average number of user sessions per day and the total for the month
The average number of page loads per day and the total for the month
The average number of unique visitors per day and the total for the month
The average number of page loads per user session
The average duration of each user session in minutes
Additionally, the last row in the table includes summary data representing the entire year.
If appropriate, you can click through on any month to view a report on that month only (the Overall Site Usage – Month View report).
This report shows which types of features get the most traffic on your site, ranking them from most visited to least visited.
Note that when you open the report, it shows the breakdown for the entire period that usage statistics have been logged, but you can use the form at the top of the screen to enter a smaller date range, if desired.
The report shows all of the following for the specified time period:
The total number of hits that this type of feature got in the specified time period
The percentage of total hits that type of feature received
The total number of unique visitors to that feature type
Note that on the Site Stats screen, the link to this feature is Portlet Usage by Instance (Ranked), but the heading when you display the report is Feature Usage by Type. The second heading is the correct one (the report does not look at instances of features; it looks at each type of feature).
With this report, a bar graph displays a breakdown of the seven days of the week, along with a percentage representing the proportion of overall usage that has occurred on that day. When you open the report, the data display represents the entire period for which data on your site exists; you can use the form at the top of the screen to specify a smaller time period, if desired.
Below the graph, a table includes the following other details:
The average number of user sessions that occurred on each day of the week and the overall total for the reporting period
The average number of page loads on each day of the week and the overall total for the reporting period
The average number of unique visitors on each day of the week and the overall total for the reporting period
The last row in the table includes summary data for all days of the week, for the entire reporting period.
With this report, a bar graph shows the percentage of total user sessions that occurred between any two hours of the day, starting with 0 to 1 (midnight to 1 a.m.) through 23-24 (11 p.m. to midnight). When you open the report, the data displayed represents the entire period that usage statistics have been logged, but you can use the form at the top of the screen to specify a smaller time period, if desired.
Below the bar graph, a table shows some additional details. For example, for each hour of the day, the system shows the following details:
The average number of user sessions that occur in that hour
The total number of user sessions that have occurred in that hour, for the duration of the reporting period
The average of number page loads that occur in that hour
The total number of page loads that have occurred in that hour, for the duration of the reporting period
The average number of unique visitors to the site during that hour
The total number of unique visitors to the site during that hour, for the duration of the reporting time period
The last row in the table includes summary data for all hours of the day, for the entire reporting period.
Manage Permissions
JICS has no permissions specific to the Reporting feature, but the following tips will help with managing access to reports:
You will also probably want to place the Reporting feature on a page that only authorized viewers can see.
You manage access to the report data through a Windows group created and managed on the server hosting Reporting Services. For details, refer to the Managing Permissions in the Usage Statistics feature section.